Immigrants from Eastern Africa vs Immigrants from Ethiopia Average Family Size
COMPARE
Immigrants from Eastern Africa
Immigrants from Ethiopia
Average Family Size
Average Family Size Comparison
Immigrants from Eastern Africa
Immigrants from Ethiopia
3.22
AVERAGE FAMILY SIZE
30.1/ 100
METRIC RATING
192nd/ 347
METRIC RANK
3.25
AVERAGE FAMILY SIZE
81.6/ 100
METRIC RATING
139th/ 347
METRIC RANK
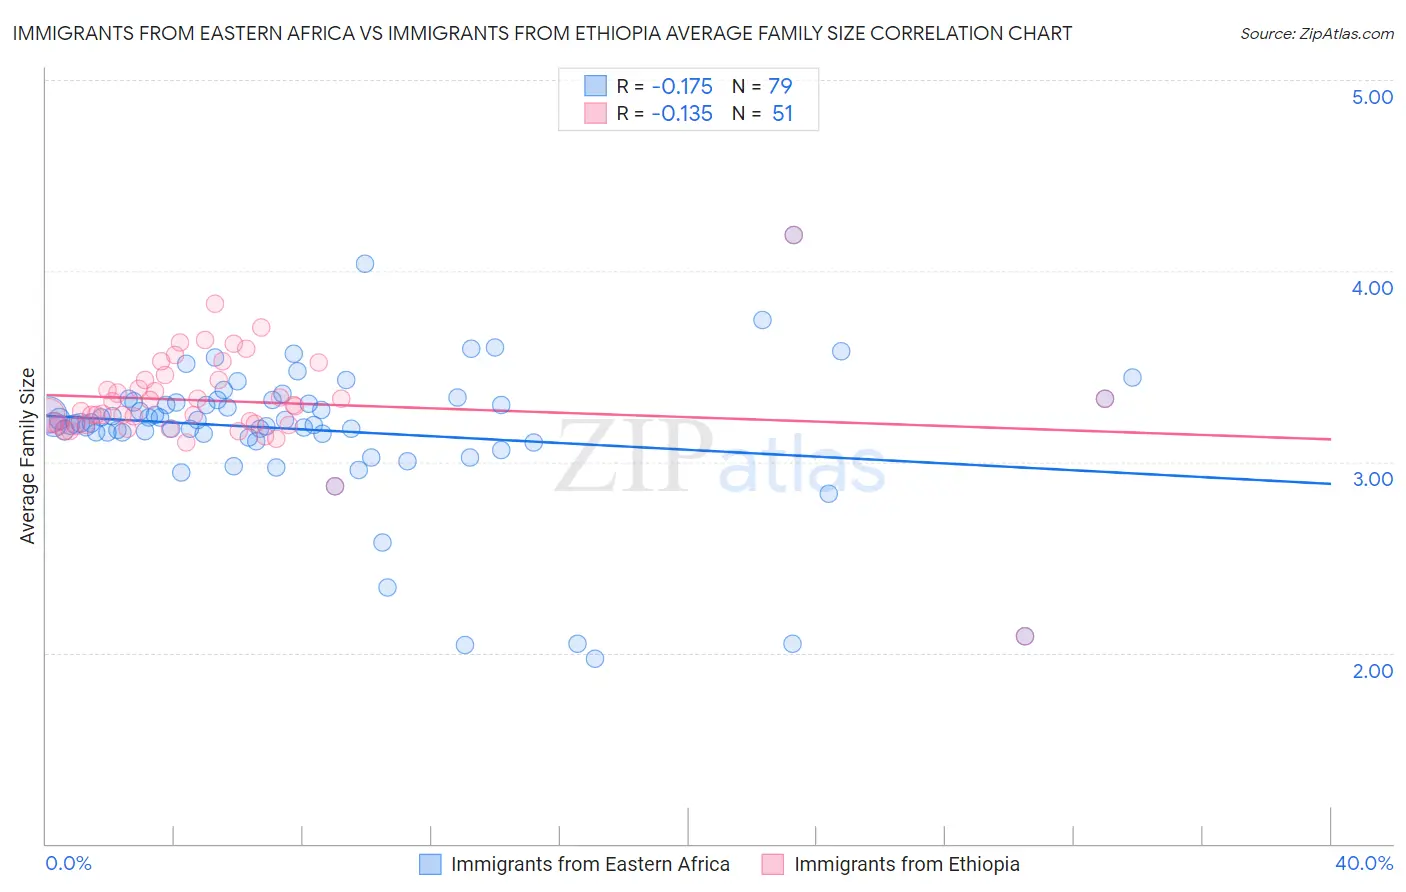
Immigrants from Eastern Africa vs Immigrants from Ethiopia Average Family Size Correlation Chart
The statistical analysis conducted on geographies consisting of 354,870,663 people shows a poor negative correlation between the proportion of Immigrants from Eastern Africa and average family size in the United States with a correlation coefficient (R) of -0.175 and weighted average of 3.22. Similarly, the statistical analysis conducted on geographies consisting of 211,454,545 people shows a poor negative correlation between the proportion of Immigrants from Ethiopia and average family size in the United States with a correlation coefficient (R) of -0.135 and weighted average of 3.25, a difference of 1.1%.
Average Family Size Correlation Summary
| Measurement | Immigrants from Eastern Africa | Immigrants from Ethiopia |
| Minimum | 1.97 | 2.09 |
| Maximum | 4.19 | 4.19 |
| Range | 2.22 | 2.10 |
| Mean | 3.17 | 3.32 |
| Median | 3.20 | 3.29 |
| Interquartile 25% (IQ1) | 3.13 | 3.19 |
| Interquartile 75% (IQ3) | 3.33 | 3.43 |
| Interquartile Range (IQR) | 0.20 | 0.24 |
| Standard Deviation (Sample) | 0.39 | 0.28 |
| Standard Deviation (Population) | 0.38 | 0.28 |
Similar Demographics by Average Family Size
Demographics Similar to Immigrants from Eastern Africa by Average Family Size
In terms of average family size, the demographic groups most similar to Immigrants from Eastern Africa are Immigrants from Zaire (3.22, a difference of 0.010%), Burmese (3.22, a difference of 0.020%), Immigrants from Israel (3.22, a difference of 0.020%), Immigrants from Sudan (3.22, a difference of 0.020%), and Choctaw (3.21, a difference of 0.040%).
| Demographics | Rating | Rank | Average Family Size |
| Immigrants | Sri Lanka | 39.8 /100 | #185 | Fair 3.22 |
| Immigrants | Argentina | 39.8 /100 | #186 | Fair 3.22 |
| Immigrants | Malaysia | 39.0 /100 | #187 | Fair 3.22 |
| Thais | 38.3 /100 | #188 | Fair 3.22 |
| Pakistanis | 33.7 /100 | #189 | Fair 3.22 |
| Burmese | 31.0 /100 | #190 | Fair 3.22 |
| Immigrants | Zaire | 30.5 /100 | #191 | Fair 3.22 |
| Immigrants | Eastern Africa | 30.1 /100 | #192 | Fair 3.22 |
| Immigrants | Israel | 29.3 /100 | #193 | Fair 3.22 |
| Immigrants | Sudan | 29.1 /100 | #194 | Fair 3.22 |
| Choctaw | 28.3 /100 | #195 | Fair 3.21 |
| Senegalese | 28.2 /100 | #196 | Fair 3.21 |
| Kenyans | 28.0 /100 | #197 | Fair 3.21 |
| Immigrants | Azores | 21.7 /100 | #198 | Fair 3.21 |
| Hmong | 20.7 /100 | #199 | Fair 3.21 |
Demographics Similar to Immigrants from Ethiopia by Average Family Size
In terms of average family size, the demographic groups most similar to Immigrants from Ethiopia are Subsaharan African (3.25, a difference of 0.0%), Cuban (3.25, a difference of 0.010%), Venezuelan (3.25, a difference of 0.010%), Liberian (3.25, a difference of 0.010%), and Immigrants from Middle Africa (3.25, a difference of 0.020%).
| Demographics | Rating | Rank | Average Family Size |
| Costa Ricans | 86.8 /100 | #132 | Excellent 3.26 |
| Immigrants | Venezuela | 86.3 /100 | #133 | Excellent 3.26 |
| Africans | 84.9 /100 | #134 | Excellent 3.25 |
| Panamanians | 84.2 /100 | #135 | Excellent 3.25 |
| Comanche | 82.8 /100 | #136 | Excellent 3.25 |
| Immigrants | Middle Africa | 82.4 /100 | #137 | Excellent 3.25 |
| Cubans | 81.8 /100 | #138 | Excellent 3.25 |
| Immigrants | Ethiopia | 81.6 /100 | #139 | Excellent 3.25 |
| Sub-Saharan Africans | 81.6 /100 | #140 | Excellent 3.25 |
| Venezuelans | 81.4 /100 | #141 | Excellent 3.25 |
| Liberians | 81.2 /100 | #142 | Excellent 3.25 |
| Bhutanese | 81.0 /100 | #143 | Excellent 3.25 |
| Tsimshian | 80.2 /100 | #144 | Excellent 3.25 |
| Armenians | 78.2 /100 | #145 | Good 3.25 |
| Immigrants | Africa | 77.9 /100 | #146 | Good 3.25 |