Zimbabwean vs Immigrants from Ethiopia Average Family Size
COMPARE
Zimbabwean
Immigrants from Ethiopia
Average Family Size
Average Family Size Comparison
Zimbabweans
Immigrants from Ethiopia
3.20
AVERAGE FAMILY SIZE
12.6/ 100
METRIC RATING
210th/ 347
METRIC RANK
3.25
AVERAGE FAMILY SIZE
81.6/ 100
METRIC RATING
139th/ 347
METRIC RANK
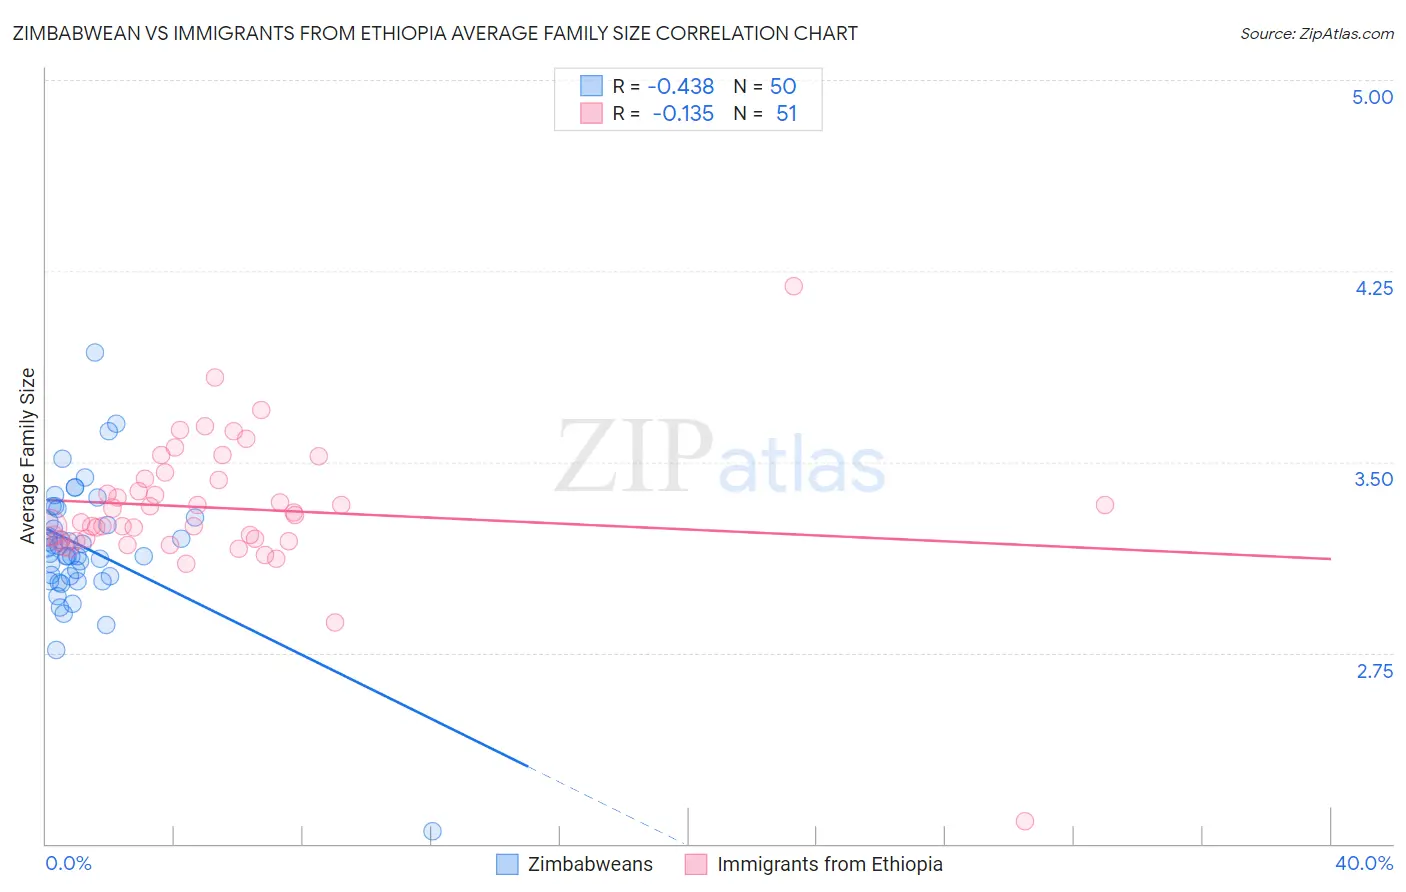
Zimbabwean vs Immigrants from Ethiopia Average Family Size Correlation Chart
The statistical analysis conducted on geographies consisting of 69,189,771 people shows a moderate negative correlation between the proportion of Zimbabweans and average family size in the United States with a correlation coefficient (R) of -0.438 and weighted average of 3.20. Similarly, the statistical analysis conducted on geographies consisting of 211,454,545 people shows a poor negative correlation between the proportion of Immigrants from Ethiopia and average family size in the United States with a correlation coefficient (R) of -0.135 and weighted average of 3.25, a difference of 1.6%.
Average Family Size Correlation Summary
| Measurement | Zimbabwean | Immigrants from Ethiopia |
| Minimum | 2.05 | 2.09 |
| Maximum | 3.93 | 4.19 |
| Range | 1.88 | 2.10 |
| Mean | 3.16 | 3.32 |
| Median | 3.15 | 3.29 |
| Interquartile 25% (IQ1) | 3.05 | 3.19 |
| Interquartile 75% (IQ3) | 3.28 | 3.43 |
| Interquartile Range (IQR) | 0.23 | 0.24 |
| Standard Deviation (Sample) | 0.26 | 0.28 |
| Standard Deviation (Population) | 0.26 | 0.28 |
Similar Demographics by Average Family Size
Demographics Similar to Zimbabweans by Average Family Size
In terms of average family size, the demographic groups most similar to Zimbabweans are Immigrants from Iran (3.20, a difference of 0.020%), Creek (3.20, a difference of 0.020%), Chippewa (3.20, a difference of 0.030%), Sudanese (3.20, a difference of 0.030%), and Filipino (3.20, a difference of 0.040%).
| Demographics | Rating | Rank | Average Family Size |
| Immigrants | Nepal | 18.1 /100 | #203 | Poor 3.21 |
| Immigrants | Poland | 16.6 /100 | #204 | Poor 3.20 |
| Paraguayans | 16.3 /100 | #205 | Poor 3.20 |
| Immigrants | Cabo Verde | 16.0 /100 | #206 | Poor 3.20 |
| Filipinos | 13.6 /100 | #207 | Poor 3.20 |
| Chippewa | 13.3 /100 | #208 | Poor 3.20 |
| Sudanese | 13.3 /100 | #209 | Poor 3.20 |
| Zimbabweans | 12.6 /100 | #210 | Poor 3.20 |
| Immigrants | Iran | 12.1 /100 | #211 | Poor 3.20 |
| Creek | 12.1 /100 | #212 | Poor 3.20 |
| Mongolians | 11.5 /100 | #213 | Poor 3.20 |
| Somalis | 11.2 /100 | #214 | Poor 3.20 |
| Delaware | 11.1 /100 | #215 | Poor 3.20 |
| Bermudans | 11.0 /100 | #216 | Poor 3.20 |
| Immigrants | Somalia | 10.3 /100 | #217 | Poor 3.20 |
Demographics Similar to Immigrants from Ethiopia by Average Family Size
In terms of average family size, the demographic groups most similar to Immigrants from Ethiopia are Subsaharan African (3.25, a difference of 0.0%), Cuban (3.25, a difference of 0.010%), Venezuelan (3.25, a difference of 0.010%), Liberian (3.25, a difference of 0.010%), and Immigrants from Middle Africa (3.25, a difference of 0.020%).
| Demographics | Rating | Rank | Average Family Size |
| Costa Ricans | 86.8 /100 | #132 | Excellent 3.26 |
| Immigrants | Venezuela | 86.3 /100 | #133 | Excellent 3.26 |
| Africans | 84.9 /100 | #134 | Excellent 3.25 |
| Panamanians | 84.2 /100 | #135 | Excellent 3.25 |
| Comanche | 82.8 /100 | #136 | Excellent 3.25 |
| Immigrants | Middle Africa | 82.4 /100 | #137 | Excellent 3.25 |
| Cubans | 81.8 /100 | #138 | Excellent 3.25 |
| Immigrants | Ethiopia | 81.6 /100 | #139 | Excellent 3.25 |
| Sub-Saharan Africans | 81.6 /100 | #140 | Excellent 3.25 |
| Venezuelans | 81.4 /100 | #141 | Excellent 3.25 |
| Liberians | 81.2 /100 | #142 | Excellent 3.25 |
| Bhutanese | 81.0 /100 | #143 | Excellent 3.25 |
| Tsimshian | 80.2 /100 | #144 | Excellent 3.25 |
| Armenians | 78.2 /100 | #145 | Good 3.25 |
| Immigrants | Africa | 77.9 /100 | #146 | Good 3.25 |