Immigrants from Vietnam vs Bahamian Currently Married
COMPARE
Immigrants from Vietnam
Bahamian
Currently Married
Currently Married Comparison
Immigrants from Vietnam
Bahamians
47.2%
CURRENTLY MARRIED
78.2/ 100
METRIC RATING
136th/ 347
METRIC RANK
41.2%
CURRENTLY MARRIED
0.0/ 100
METRIC RATING
318th/ 347
METRIC RANK
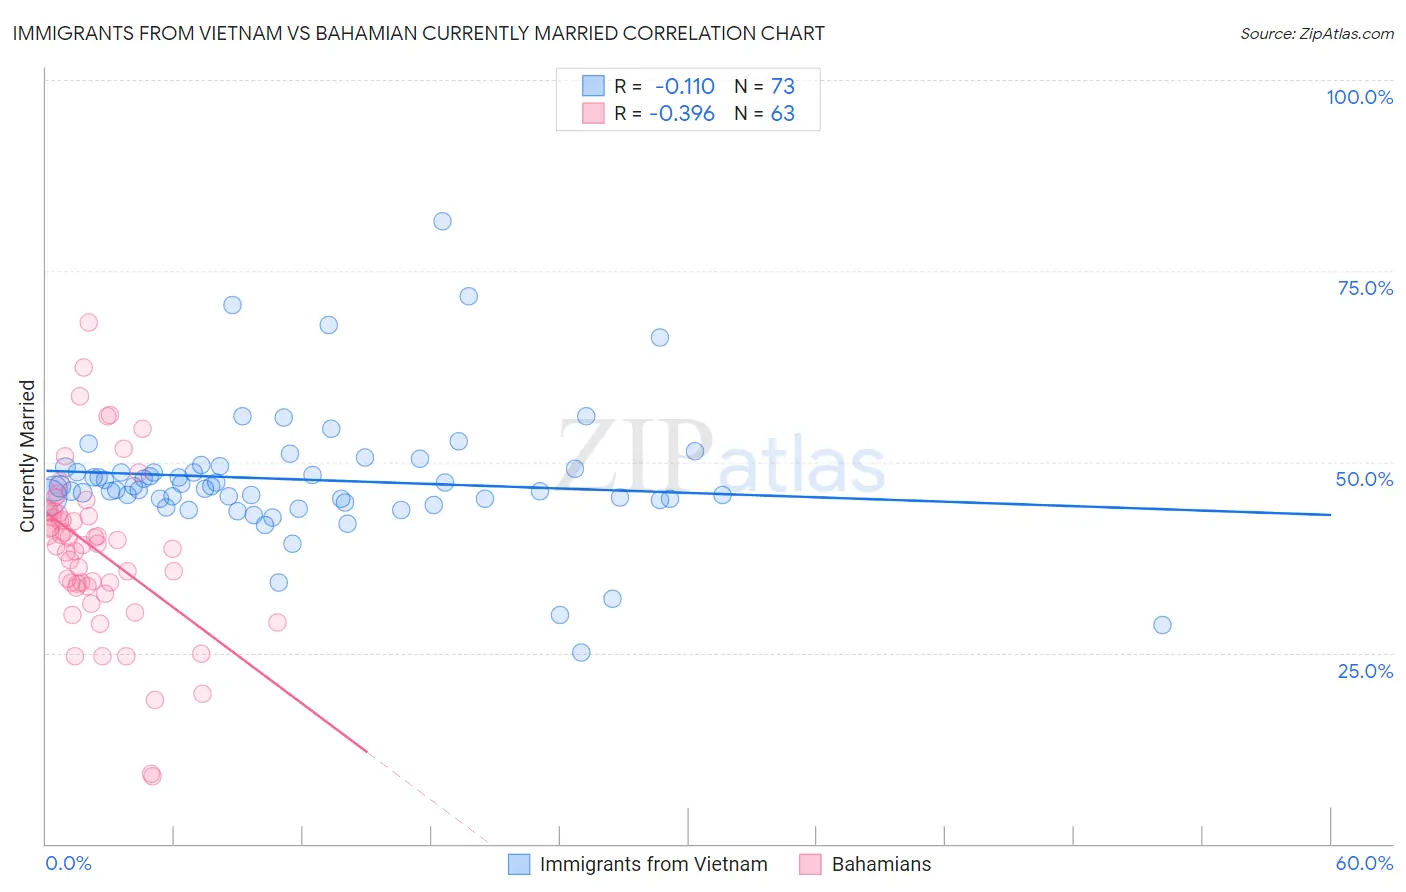
Immigrants from Vietnam vs Bahamian Currently Married Correlation Chart
The statistical analysis conducted on geographies consisting of 404,782,059 people shows a poor negative correlation between the proportion of Immigrants from Vietnam and percentage of population currently married in the United States with a correlation coefficient (R) of -0.110 and weighted average of 47.2%. Similarly, the statistical analysis conducted on geographies consisting of 112,687,531 people shows a mild negative correlation between the proportion of Bahamians and percentage of population currently married in the United States with a correlation coefficient (R) of -0.396 and weighted average of 41.2%, a difference of 14.6%.
Currently Married Correlation Summary
| Measurement | Immigrants from Vietnam | Bahamian |
| Minimum | 25.0% | 8.9% |
| Maximum | 81.5% | 68.3% |
| Range | 56.5% | 59.4% |
| Mean | 47.7% | 38.6% |
| Median | 46.5% | 39.3% |
| Interquartile 25% (IQ1) | 45.0% | 33.7% |
| Interquartile 75% (IQ3) | 49.2% | 43.5% |
| Interquartile Range (IQR) | 4.1% | 9.8% |
| Standard Deviation (Sample) | 8.6% | 10.9% |
| Standard Deviation (Population) | 8.5% | 10.9% |
Similar Demographics by Currently Married
Demographics Similar to Immigrants from Vietnam by Currently Married
In terms of currently married, the demographic groups most similar to Immigrants from Vietnam are Paraguayan (47.2%, a difference of 0.020%), Pakistani (47.2%, a difference of 0.040%), Yugoslavian (47.2%, a difference of 0.040%), Immigrants from Norway (47.2%, a difference of 0.080%), and Cajun (47.1%, a difference of 0.15%).
| Demographics | Rating | Rank | Currently Married |
| Sri Lankans | 83.2 /100 | #129 | Excellent 47.3% |
| Immigrants | Iraq | 82.8 /100 | #130 | Excellent 47.3% |
| Icelanders | 82.4 /100 | #131 | Excellent 47.3% |
| Afghans | 81.8 /100 | #132 | Excellent 47.3% |
| Immigrants | Malaysia | 81.1 /100 | #133 | Excellent 47.3% |
| Immigrants | Australia | 81.1 /100 | #134 | Excellent 47.3% |
| Immigrants | Norway | 79.7 /100 | #135 | Good 47.2% |
| Immigrants | Vietnam | 78.2 /100 | #136 | Good 47.2% |
| Paraguayans | 77.8 /100 | #137 | Good 47.2% |
| Pakistanis | 77.5 /100 | #138 | Good 47.2% |
| Yugoslavians | 77.4 /100 | #139 | Good 47.2% |
| Cajuns | 75.3 /100 | #140 | Good 47.1% |
| Venezuelans | 74.4 /100 | #141 | Good 47.1% |
| Argentineans | 74.4 /100 | #142 | Good 47.1% |
| Guamanians/Chamorros | 74.2 /100 | #143 | Good 47.1% |
Demographics Similar to Bahamians by Currently Married
In terms of currently married, the demographic groups most similar to Bahamians are Immigrants from Somalia (41.2%, a difference of 0.020%), Immigrants from Jamaica (41.1%, a difference of 0.080%), Haitian (41.3%, a difference of 0.18%), Immigrants from Caribbean (41.3%, a difference of 0.20%), and Inupiat (41.3%, a difference of 0.26%).
| Demographics | Rating | Rank | Currently Married |
| Trinidadians and Tobagonians | 0.0 /100 | #311 | Tragic 41.5% |
| Somalis | 0.0 /100 | #312 | Tragic 41.5% |
| Jamaicans | 0.0 /100 | #313 | Tragic 41.4% |
| West Indians | 0.0 /100 | #314 | Tragic 41.3% |
| Inupiat | 0.0 /100 | #315 | Tragic 41.3% |
| Immigrants | Caribbean | 0.0 /100 | #316 | Tragic 41.3% |
| Haitians | 0.0 /100 | #317 | Tragic 41.3% |
| Bahamians | 0.0 /100 | #318 | Tragic 41.2% |
| Immigrants | Somalia | 0.0 /100 | #319 | Tragic 41.2% |
| Immigrants | Jamaica | 0.0 /100 | #320 | Tragic 41.1% |
| Immigrants | Congo | 0.0 /100 | #321 | Tragic 41.1% |
| Immigrants | Haiti | 0.0 /100 | #322 | Tragic 41.0% |
| Immigrants | West Indies | 0.0 /100 | #323 | Tragic 40.7% |
| Immigrants | Senegal | 0.0 /100 | #324 | Tragic 40.7% |
| U.S. Virgin Islanders | 0.0 /100 | #325 | Tragic 40.7% |