Immigrants from Portugal vs Bahamian Currently Married
COMPARE
Immigrants from Portugal
Bahamian
Currently Married
Currently Married Comparison
Immigrants from Portugal
Bahamians
45.2%
CURRENTLY MARRIED
3.5/ 100
METRIC RATING
219th/ 347
METRIC RANK
41.2%
CURRENTLY MARRIED
0.0/ 100
METRIC RATING
318th/ 347
METRIC RANK
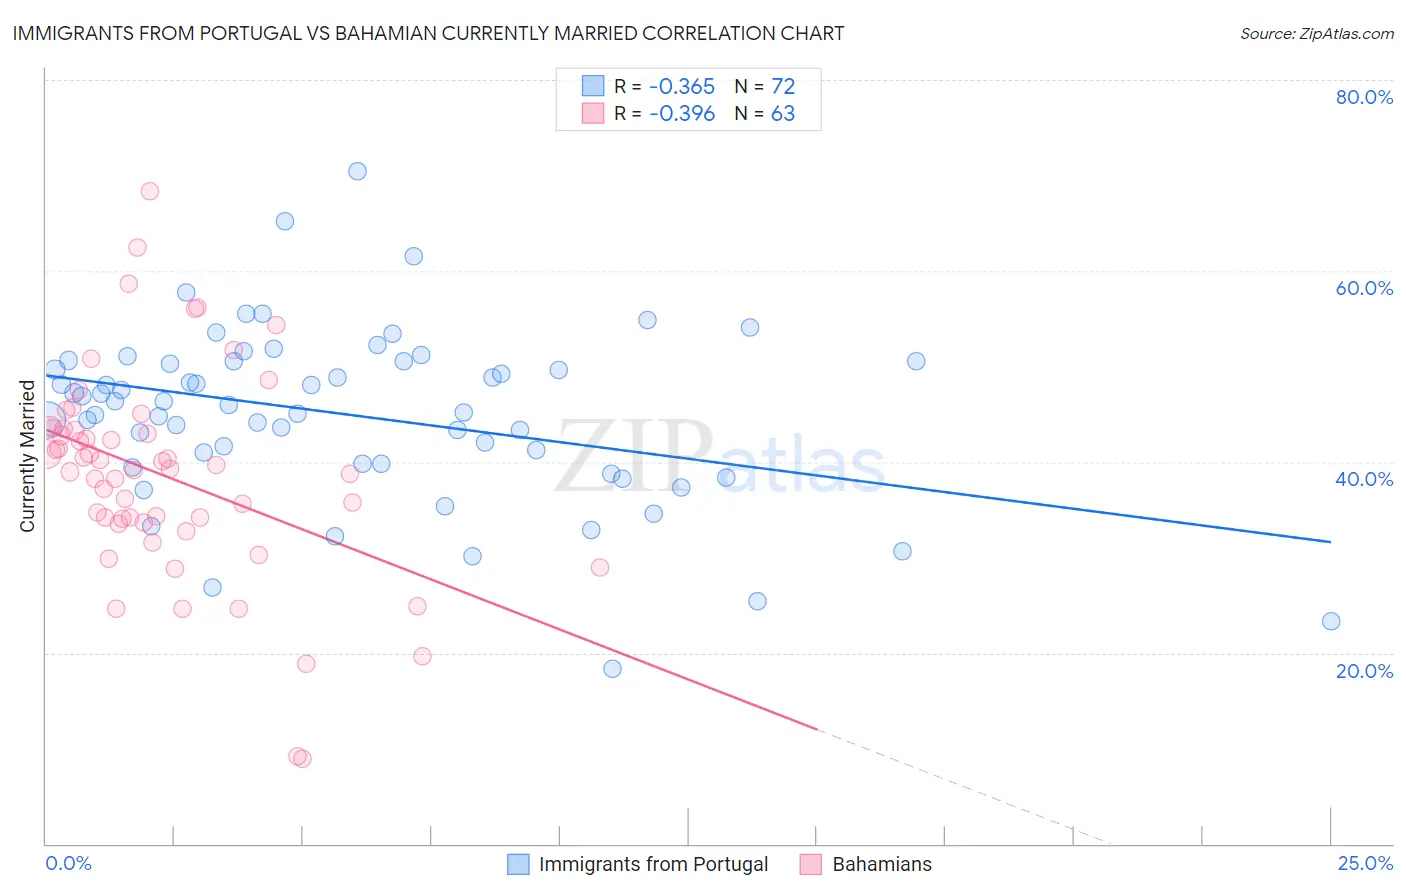
Immigrants from Portugal vs Bahamian Currently Married Correlation Chart
The statistical analysis conducted on geographies consisting of 174,784,868 people shows a mild negative correlation between the proportion of Immigrants from Portugal and percentage of population currently married in the United States with a correlation coefficient (R) of -0.365 and weighted average of 45.2%. Similarly, the statistical analysis conducted on geographies consisting of 112,687,531 people shows a mild negative correlation between the proportion of Bahamians and percentage of population currently married in the United States with a correlation coefficient (R) of -0.396 and weighted average of 41.2%, a difference of 9.8%.
Currently Married Correlation Summary
| Measurement | Immigrants from Portugal | Bahamian |
| Minimum | 18.3% | 8.9% |
| Maximum | 70.5% | 68.3% |
| Range | 52.2% | 59.4% |
| Mean | 44.9% | 38.6% |
| Median | 46.1% | 39.3% |
| Interquartile 25% (IQ1) | 39.8% | 33.7% |
| Interquartile 75% (IQ3) | 50.5% | 43.5% |
| Interquartile Range (IQR) | 10.8% | 9.8% |
| Standard Deviation (Sample) | 9.1% | 10.9% |
| Standard Deviation (Population) | 9.1% | 10.9% |
Similar Demographics by Currently Married
Demographics Similar to Immigrants from Portugal by Currently Married
In terms of currently married, the demographic groups most similar to Immigrants from Portugal are Panamanian (45.3%, a difference of 0.12%), Kenyan (45.2%, a difference of 0.13%), Mexican (45.2%, a difference of 0.14%), Immigrants from the Azores (45.1%, a difference of 0.34%), and Immigrants from Thailand (45.4%, a difference of 0.36%).
| Demographics | Rating | Rank | Currently Married |
| Marshallese | 7.2 /100 | #212 | Tragic 45.5% |
| Alaska Natives | 7.0 /100 | #213 | Tragic 45.5% |
| Dutch West Indians | 6.7 /100 | #214 | Tragic 45.5% |
| German Russians | 6.7 /100 | #215 | Tragic 45.5% |
| Immigrants | Morocco | 5.5 /100 | #216 | Tragic 45.4% |
| Immigrants | Thailand | 5.1 /100 | #217 | Tragic 45.4% |
| Panamanians | 4.0 /100 | #218 | Tragic 45.3% |
| Immigrants | Portugal | 3.5 /100 | #219 | Tragic 45.2% |
| Kenyans | 3.1 /100 | #220 | Tragic 45.2% |
| Mexicans | 3.0 /100 | #221 | Tragic 45.2% |
| Immigrants | Azores | 2.5 /100 | #222 | Tragic 45.1% |
| Immigrants | Laos | 2.3 /100 | #223 | Tragic 45.0% |
| Immigrants | Uganda | 2.2 /100 | #224 | Tragic 45.0% |
| French American Indians | 2.2 /100 | #225 | Tragic 45.0% |
| Comanche | 2.1 /100 | #226 | Tragic 45.0% |
Demographics Similar to Bahamians by Currently Married
In terms of currently married, the demographic groups most similar to Bahamians are Immigrants from Somalia (41.2%, a difference of 0.020%), Immigrants from Jamaica (41.1%, a difference of 0.080%), Haitian (41.3%, a difference of 0.18%), Immigrants from Caribbean (41.3%, a difference of 0.20%), and Inupiat (41.3%, a difference of 0.26%).
| Demographics | Rating | Rank | Currently Married |
| Trinidadians and Tobagonians | 0.0 /100 | #311 | Tragic 41.5% |
| Somalis | 0.0 /100 | #312 | Tragic 41.5% |
| Jamaicans | 0.0 /100 | #313 | Tragic 41.4% |
| West Indians | 0.0 /100 | #314 | Tragic 41.3% |
| Inupiat | 0.0 /100 | #315 | Tragic 41.3% |
| Immigrants | Caribbean | 0.0 /100 | #316 | Tragic 41.3% |
| Haitians | 0.0 /100 | #317 | Tragic 41.3% |
| Bahamians | 0.0 /100 | #318 | Tragic 41.2% |
| Immigrants | Somalia | 0.0 /100 | #319 | Tragic 41.2% |
| Immigrants | Jamaica | 0.0 /100 | #320 | Tragic 41.1% |
| Immigrants | Congo | 0.0 /100 | #321 | Tragic 41.1% |
| Immigrants | Haiti | 0.0 /100 | #322 | Tragic 41.0% |
| Immigrants | West Indies | 0.0 /100 | #323 | Tragic 40.7% |
| Immigrants | Senegal | 0.0 /100 | #324 | Tragic 40.7% |
| U.S. Virgin Islanders | 0.0 /100 | #325 | Tragic 40.7% |