Immigrants from Taiwan vs Bahamian Currently Married
COMPARE
Immigrants from Taiwan
Bahamian
Currently Married
Currently Married Comparison
Immigrants from Taiwan
Bahamians
50.7%
CURRENTLY MARRIED
100.0/ 100
METRIC RATING
4th/ 347
METRIC RANK
41.2%
CURRENTLY MARRIED
0.0/ 100
METRIC RATING
318th/ 347
METRIC RANK
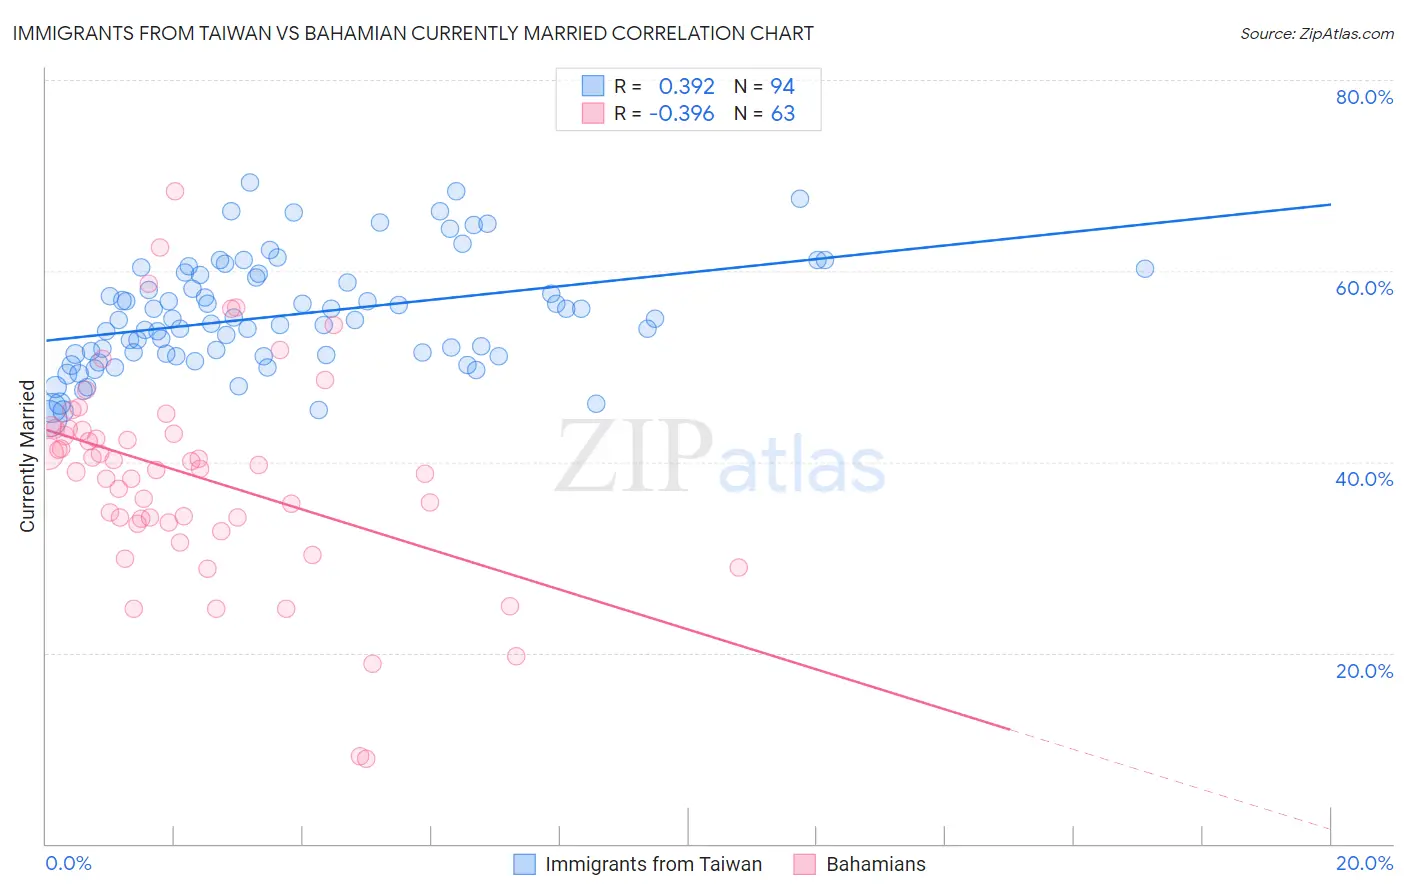
Immigrants from Taiwan vs Bahamian Currently Married Correlation Chart
The statistical analysis conducted on geographies consisting of 298,249,316 people shows a mild positive correlation between the proportion of Immigrants from Taiwan and percentage of population currently married in the United States with a correlation coefficient (R) of 0.392 and weighted average of 50.7%. Similarly, the statistical analysis conducted on geographies consisting of 112,687,531 people shows a mild negative correlation between the proportion of Bahamians and percentage of population currently married in the United States with a correlation coefficient (R) of -0.396 and weighted average of 41.2%, a difference of 23.2%.
Currently Married Correlation Summary
| Measurement | Immigrants from Taiwan | Bahamian |
| Minimum | 44.5% | 8.9% |
| Maximum | 69.2% | 68.3% |
| Range | 24.8% | 59.4% |
| Mean | 55.4% | 38.6% |
| Median | 54.8% | 39.3% |
| Interquartile 25% (IQ1) | 51.2% | 33.7% |
| Interquartile 75% (IQ3) | 59.6% | 43.5% |
| Interquartile Range (IQR) | 8.4% | 9.8% |
| Standard Deviation (Sample) | 5.8% | 10.9% |
| Standard Deviation (Population) | 5.7% | 10.9% |
Similar Demographics by Currently Married
Demographics Similar to Immigrants from Taiwan by Currently Married
In terms of currently married, the demographic groups most similar to Immigrants from Taiwan are Assyrian/Chaldean/Syriac (50.8%, a difference of 0.080%), Thai (50.9%, a difference of 0.26%), Danish (50.5%, a difference of 0.55%), Norwegian (50.2%, a difference of 1.1%), and Immigrants from South Central Asia (50.0%, a difference of 1.4%).
| Demographics | Rating | Rank | Currently Married |
| Immigrants | India | 100.0 /100 | #1 | Exceptional 51.8% |
| Thais | 100.0 /100 | #2 | Exceptional 50.9% |
| Assyrians/Chaldeans/Syriacs | 100.0 /100 | #3 | Exceptional 50.8% |
| Immigrants | Taiwan | 100.0 /100 | #4 | Exceptional 50.7% |
| Danes | 100.0 /100 | #5 | Exceptional 50.5% |
| Norwegians | 100.0 /100 | #6 | Exceptional 50.2% |
| Immigrants | South Central Asia | 100.0 /100 | #7 | Exceptional 50.0% |
| Swedes | 100.0 /100 | #8 | Exceptional 50.0% |
| Czechs | 99.9 /100 | #9 | Exceptional 49.9% |
| Filipinos | 99.9 /100 | #10 | Exceptional 49.7% |
| English | 99.9 /100 | #11 | Exceptional 49.7% |
| Swiss | 99.9 /100 | #12 | Exceptional 49.7% |
| Dutch | 99.9 /100 | #13 | Exceptional 49.6% |
| Germans | 99.9 /100 | #14 | Exceptional 49.6% |
| Pennsylvania Germans | 99.9 /100 | #15 | Exceptional 49.6% |
Demographics Similar to Bahamians by Currently Married
In terms of currently married, the demographic groups most similar to Bahamians are Immigrants from Somalia (41.2%, a difference of 0.020%), Immigrants from Jamaica (41.1%, a difference of 0.080%), Haitian (41.3%, a difference of 0.18%), Immigrants from Caribbean (41.3%, a difference of 0.20%), and Inupiat (41.3%, a difference of 0.26%).
| Demographics | Rating | Rank | Currently Married |
| Trinidadians and Tobagonians | 0.0 /100 | #311 | Tragic 41.5% |
| Somalis | 0.0 /100 | #312 | Tragic 41.5% |
| Jamaicans | 0.0 /100 | #313 | Tragic 41.4% |
| West Indians | 0.0 /100 | #314 | Tragic 41.3% |
| Inupiat | 0.0 /100 | #315 | Tragic 41.3% |
| Immigrants | Caribbean | 0.0 /100 | #316 | Tragic 41.3% |
| Haitians | 0.0 /100 | #317 | Tragic 41.3% |
| Bahamians | 0.0 /100 | #318 | Tragic 41.2% |
| Immigrants | Somalia | 0.0 /100 | #319 | Tragic 41.2% |
| Immigrants | Jamaica | 0.0 /100 | #320 | Tragic 41.1% |
| Immigrants | Congo | 0.0 /100 | #321 | Tragic 41.1% |
| Immigrants | Haiti | 0.0 /100 | #322 | Tragic 41.0% |
| Immigrants | West Indies | 0.0 /100 | #323 | Tragic 40.7% |
| Immigrants | Senegal | 0.0 /100 | #324 | Tragic 40.7% |
| U.S. Virgin Islanders | 0.0 /100 | #325 | Tragic 40.7% |