Polish vs Immigrants from Eritrea Births to Unmarried Women
COMPARE
Polish
Immigrants from Eritrea
Births to Unmarried Women
Births to Unmarried Women Comparison
Poles
Immigrants from Eritrea
30.8%
BIRTHS TO UNMARRIED WOMEN
76.2/ 100
METRIC RATING
152nd/ 347
METRIC RANK
31.7%
BIRTHS TO UNMARRIED WOMEN
50.4/ 100
METRIC RATING
172nd/ 347
METRIC RANK
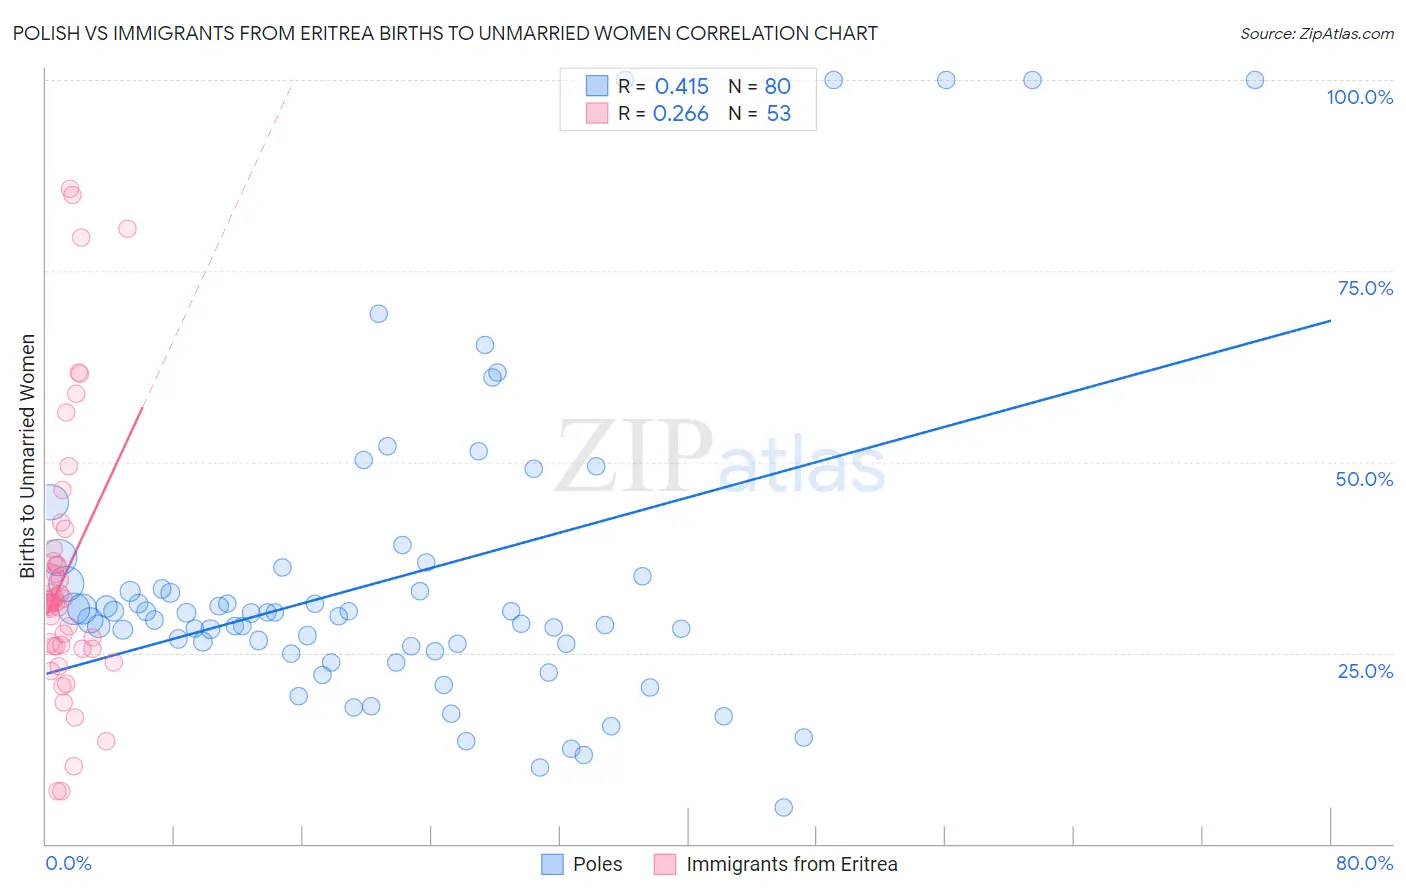
Polish vs Immigrants from Eritrea Births to Unmarried Women Correlation Chart
The statistical analysis conducted on geographies consisting of 497,645,952 people shows a moderate positive correlation between the proportion of Poles and percentage of births to unmarried women in the United States with a correlation coefficient (R) of 0.415 and weighted average of 30.8%. Similarly, the statistical analysis conducted on geographies consisting of 103,370,880 people shows a weak positive correlation between the proportion of Immigrants from Eritrea and percentage of births to unmarried women in the United States with a correlation coefficient (R) of 0.266 and weighted average of 31.7%, a difference of 2.8%.
Births to Unmarried Women Correlation Summary
| Measurement | Polish | Immigrants from Eritrea |
| Minimum | 4.8% | 6.8% |
| Maximum | 100.0% | 85.7% |
| Range | 95.2% | 78.9% |
| Mean | 34.7% | 35.2% |
| Median | 30.0% | 31.6% |
| Interquartile 25% (IQ1) | 25.6% | 25.8% |
| Interquartile 75% (IQ3) | 34.5% | 37.8% |
| Interquartile Range (IQR) | 9.0% | 12.0% |
| Standard Deviation (Sample) | 20.7% | 18.1% |
| Standard Deviation (Population) | 20.6% | 17.9% |
Demographics Similar to Poles and Immigrants from Eritrea by Births to Unmarried Women
In terms of births to unmarried women, the demographic groups most similar to Poles are British (30.8%, a difference of 0.020%), Yugoslavian (30.8%, a difference of 0.14%), Immigrants from Bangladesh (30.9%, a difference of 0.29%), Carpatho Rusyn (30.9%, a difference of 0.34%), and Immigrants from Eastern Africa (31.0%, a difference of 0.52%). Similarly, the demographic groups most similar to Immigrants from Eritrea are Finnish (31.7%, a difference of 0.010%), Guamanian/Chamorro (31.6%, a difference of 0.090%), Slavic (31.6%, a difference of 0.15%), Belgian (31.6%, a difference of 0.19%), and Dutch (31.5%, a difference of 0.46%).
| Demographics | Rating | Rank | Births to Unmarried Women |
| Poles | 76.2 /100 | #152 | Good 30.8% |
| British | 76.0 /100 | #153 | Good 30.8% |
| Yugoslavians | 75.1 /100 | #154 | Good 30.8% |
| Immigrants | Bangladesh | 73.9 /100 | #155 | Good 30.9% |
| Carpatho Rusyns | 73.5 /100 | #156 | Good 30.9% |
| Immigrants | Eastern Africa | 72.1 /100 | #157 | Good 31.0% |
| Austrians | 69.9 /100 | #158 | Good 31.0% |
| Immigrants | England | 69.4 /100 | #159 | Good 31.1% |
| Immigrants | Western Europe | 69.3 /100 | #160 | Good 31.1% |
| Immigrants | Southern Europe | 68.7 /100 | #161 | Good 31.1% |
| Slovenes | 65.9 /100 | #162 | Good 31.2% |
| Immigrants | Chile | 65.7 /100 | #163 | Good 31.2% |
| Hungarians | 64.1 /100 | #164 | Good 31.2% |
| Immigrants | Somalia | 58.1 /100 | #165 | Average 31.4% |
| Peruvians | 55.5 /100 | #166 | Average 31.5% |
| Dutch | 55.3 /100 | #167 | Average 31.5% |
| Belgians | 52.4 /100 | #168 | Average 31.6% |
| Slavs | 52.0 /100 | #169 | Average 31.6% |
| Guamanians/Chamorros | 51.3 /100 | #170 | Average 31.6% |
| Finns | 50.5 /100 | #171 | Average 31.7% |
| Immigrants | Eritrea | 50.4 /100 | #172 | Average 31.7% |