Bhutanese vs Immigrants from Eritrea Births to Unmarried Women
COMPARE
Bhutanese
Immigrants from Eritrea
Births to Unmarried Women
Births to Unmarried Women Comparison
Bhutanese
Immigrants from Eritrea
27.9%
BIRTHS TO UNMARRIED WOMEN
99.4/ 100
METRIC RATING
52nd/ 347
METRIC RANK
31.7%
BIRTHS TO UNMARRIED WOMEN
50.4/ 100
METRIC RATING
172nd/ 347
METRIC RANK
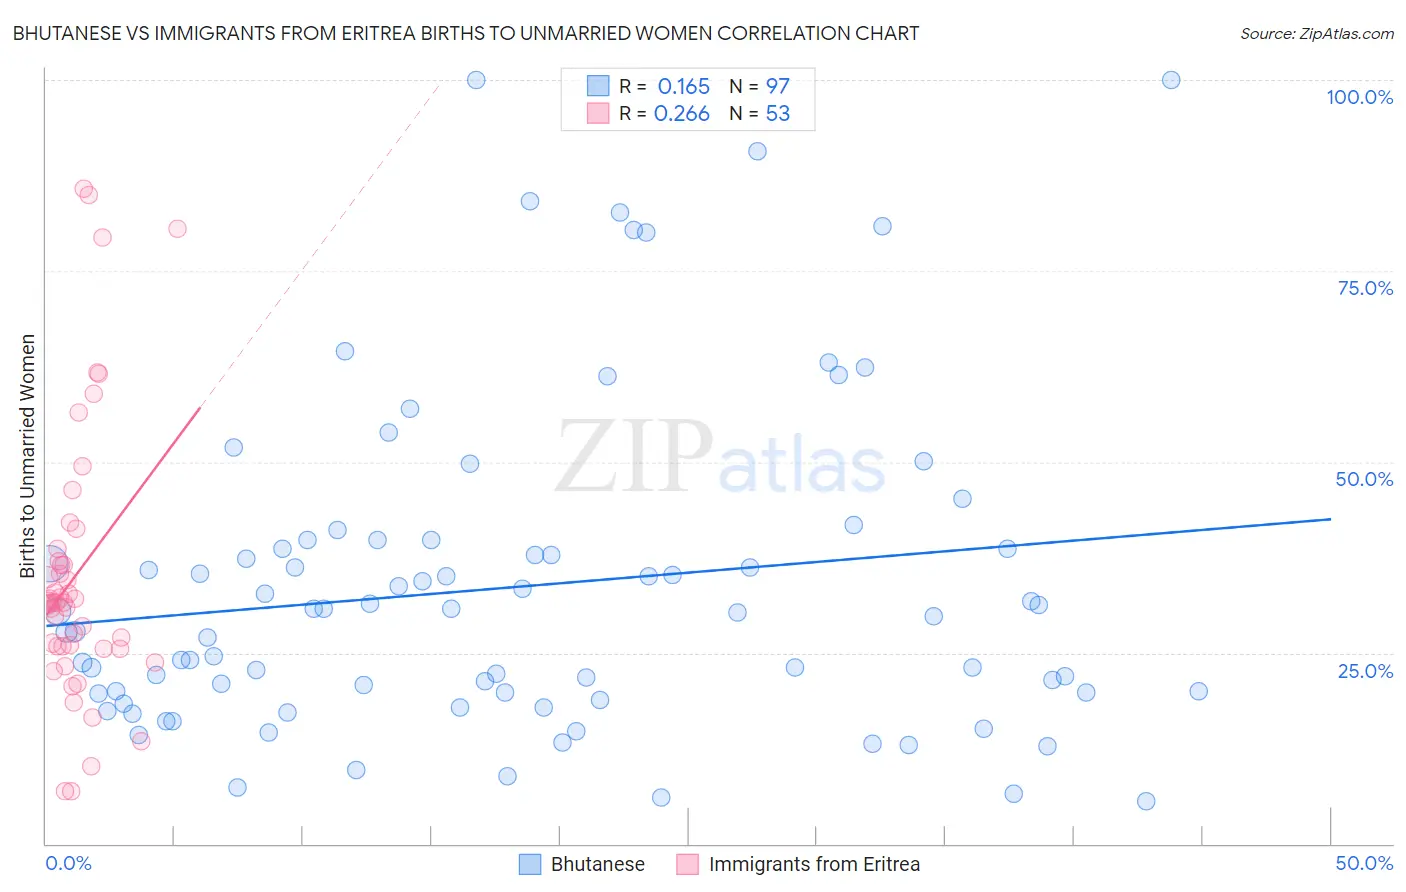
Bhutanese vs Immigrants from Eritrea Births to Unmarried Women Correlation Chart
The statistical analysis conducted on geographies consisting of 420,866,190 people shows a poor positive correlation between the proportion of Bhutanese and percentage of births to unmarried women in the United States with a correlation coefficient (R) of 0.165 and weighted average of 27.9%. Similarly, the statistical analysis conducted on geographies consisting of 103,370,880 people shows a weak positive correlation between the proportion of Immigrants from Eritrea and percentage of births to unmarried women in the United States with a correlation coefficient (R) of 0.266 and weighted average of 31.7%, a difference of 13.6%.
Births to Unmarried Women Correlation Summary
| Measurement | Bhutanese | Immigrants from Eritrea |
| Minimum | 5.5% | 6.8% |
| Maximum | 100.0% | 85.7% |
| Range | 94.5% | 78.9% |
| Mean | 33.6% | 35.2% |
| Median | 30.3% | 31.6% |
| Interquartile 25% (IQ1) | 19.7% | 25.8% |
| Interquartile 75% (IQ3) | 39.2% | 37.8% |
| Interquartile Range (IQR) | 19.4% | 12.0% |
| Standard Deviation (Sample) | 21.1% | 18.1% |
| Standard Deviation (Population) | 21.0% | 17.9% |
Similar Demographics by Births to Unmarried Women
Demographics Similar to Bhutanese by Births to Unmarried Women
In terms of births to unmarried women, the demographic groups most similar to Bhutanese are Immigrants from Romania (27.9%, a difference of 0.020%), Macedonian (27.9%, a difference of 0.040%), Afghan (27.9%, a difference of 0.090%), Mongolian (27.9%, a difference of 0.12%), and Maltese (27.8%, a difference of 0.17%).
| Demographics | Rating | Rank | Births to Unmarried Women |
| Latvians | 99.5 /100 | #45 | Exceptional 27.7% |
| Immigrants | Lithuania | 99.5 /100 | #46 | Exceptional 27.7% |
| Hmong | 99.5 /100 | #47 | Exceptional 27.7% |
| Eastern Europeans | 99.5 /100 | #48 | Exceptional 27.7% |
| Immigrants | Greece | 99.4 /100 | #49 | Exceptional 27.8% |
| Maltese | 99.4 /100 | #50 | Exceptional 27.8% |
| Macedonians | 99.4 /100 | #51 | Exceptional 27.9% |
| Bhutanese | 99.4 /100 | #52 | Exceptional 27.9% |
| Immigrants | Romania | 99.4 /100 | #53 | Exceptional 27.9% |
| Afghans | 99.4 /100 | #54 | Exceptional 27.9% |
| Mongolians | 99.3 /100 | #55 | Exceptional 27.9% |
| Immigrants | Belgium | 99.3 /100 | #56 | Exceptional 28.0% |
| Russians | 99.2 /100 | #57 | Exceptional 28.0% |
| Immigrants | Albania | 99.2 /100 | #58 | Exceptional 28.0% |
| Immigrants | Kazakhstan | 99.1 /100 | #59 | Exceptional 28.1% |
Demographics Similar to Immigrants from Eritrea by Births to Unmarried Women
In terms of births to unmarried women, the demographic groups most similar to Immigrants from Eritrea are Finnish (31.7%, a difference of 0.010%), Immigrants from Yemen (31.7%, a difference of 0.020%), Venezuelan (31.7%, a difference of 0.040%), Guamanian/Chamorro (31.6%, a difference of 0.090%), and Immigrants from Venezuela (31.7%, a difference of 0.12%).
| Demographics | Rating | Rank | Births to Unmarried Women |
| Immigrants | Somalia | 58.1 /100 | #165 | Average 31.4% |
| Peruvians | 55.5 /100 | #166 | Average 31.5% |
| Dutch | 55.3 /100 | #167 | Average 31.5% |
| Belgians | 52.4 /100 | #168 | Average 31.6% |
| Slavs | 52.0 /100 | #169 | Average 31.6% |
| Guamanians/Chamorros | 51.3 /100 | #170 | Average 31.6% |
| Finns | 50.5 /100 | #171 | Average 31.7% |
| Immigrants | Eritrea | 50.4 /100 | #172 | Average 31.7% |
| Immigrants | Yemen | 50.2 /100 | #173 | Average 31.7% |
| Venezuelans | 50.0 /100 | #174 | Average 31.7% |
| Immigrants | Venezuela | 49.2 /100 | #175 | Average 31.7% |
| Scottish | 48.1 /100 | #176 | Average 31.7% |
| South American Indians | 47.7 /100 | #177 | Average 31.7% |
| English | 47.4 /100 | #178 | Average 31.7% |
| South Americans | 46.9 /100 | #179 | Average 31.8% |