Arab vs Lumbee Married-couple Households
COMPARE
Arab
Lumbee
Married-couple Households
Married-couple Households Comparison
Arabs
Lumbee
46.9%
MARRIED-COUPLE HOUSEHOLDS
76.0/ 100
METRIC RATING
155th/ 347
METRIC RANK
39.6%
MARRIED-COUPLE HOUSEHOLDS
0.0/ 100
METRIC RATING
327th/ 347
METRIC RANK
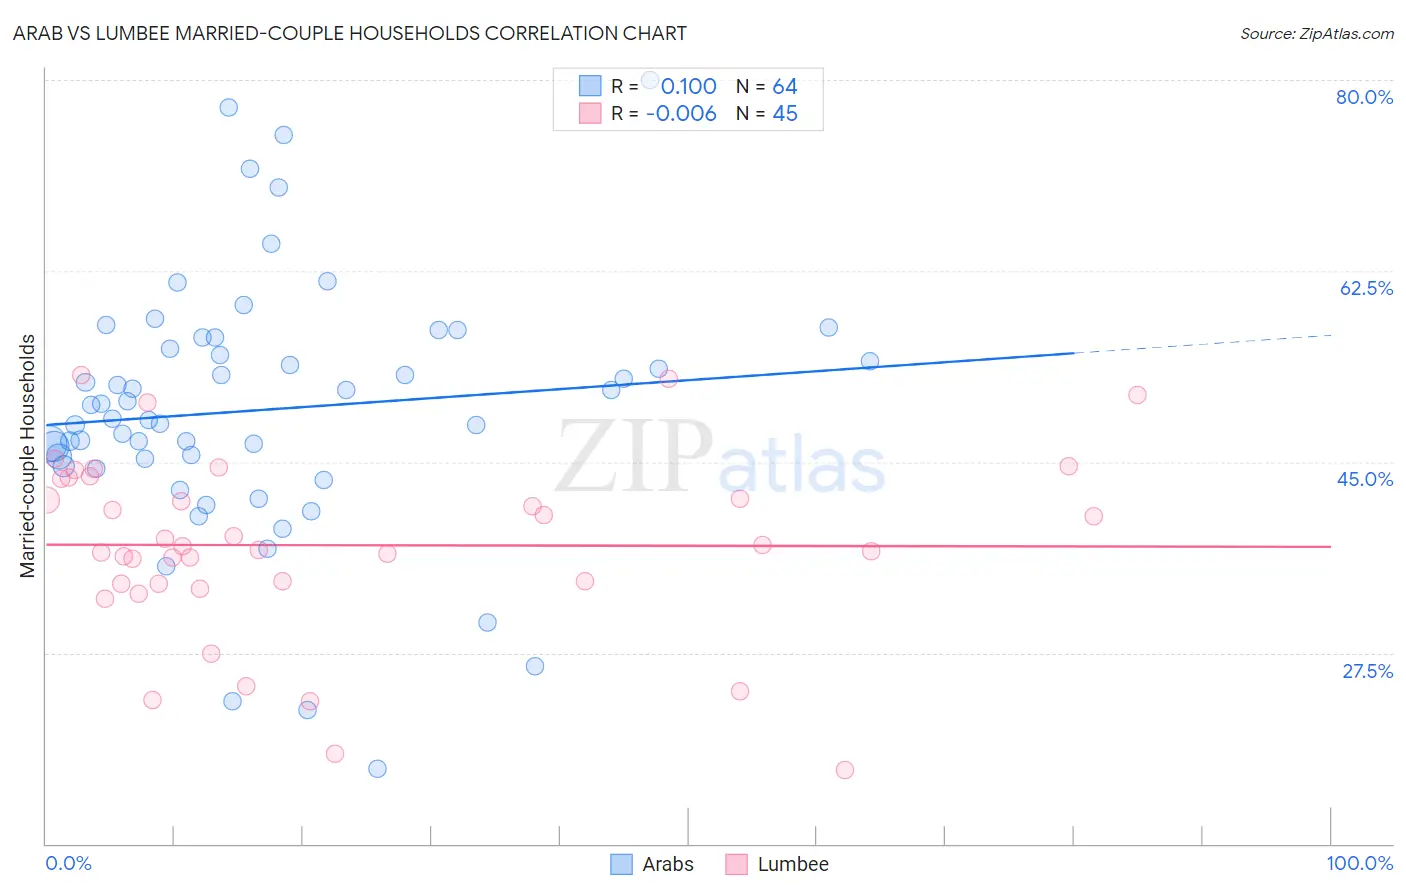
Arab vs Lumbee Married-couple Households Correlation Chart
The statistical analysis conducted on geographies consisting of 486,357,143 people shows a slight positive correlation between the proportion of Arabs and percentage of married-couple family households in the United States with a correlation coefficient (R) of 0.100 and weighted average of 46.9%. Similarly, the statistical analysis conducted on geographies consisting of 92,264,260 people shows no correlation between the proportion of Lumbee and percentage of married-couple family households in the United States with a correlation coefficient (R) of -0.006 and weighted average of 39.6%, a difference of 18.5%.
Married-couple Households Correlation Summary
| Measurement | Arab | Lumbee |
| Minimum | 16.8% | 16.8% |
| Maximum | 80.0% | 53.0% |
| Range | 63.2% | 36.2% |
| Mean | 49.8% | 37.4% |
| Median | 49.6% | 37.3% |
| Interquartile 25% (IQ1) | 45.0% | 33.9% |
| Interquartile 75% (IQ3) | 55.9% | 43.5% |
| Interquartile Range (IQR) | 11.0% | 9.7% |
| Standard Deviation (Sample) | 11.9% | 8.3% |
| Standard Deviation (Population) | 11.8% | 8.2% |
Similar Demographics by Married-couple Households
Demographics Similar to Arabs by Married-couple Households
In terms of married-couple households, the demographic groups most similar to Arabs are Hmong (47.0%, a difference of 0.010%), Immigrants from Western Asia (46.9%, a difference of 0.010%), Serbian (47.0%, a difference of 0.020%), Armenian (46.9%, a difference of 0.030%), and Immigrants from Bulgaria (47.0%, a difference of 0.040%).
| Demographics | Rating | Rank | Married-couple Households |
| Icelanders | 79.5 /100 | #148 | Good 47.0% |
| Paraguayans | 78.7 /100 | #149 | Good 47.0% |
| Immigrants | Russia | 77.6 /100 | #150 | Good 47.0% |
| Immigrants | Bulgaria | 76.8 /100 | #151 | Good 47.0% |
| Serbians | 76.3 /100 | #152 | Good 47.0% |
| Hmong | 76.2 /100 | #153 | Good 47.0% |
| Immigrants | Western Asia | 76.1 /100 | #154 | Good 46.9% |
| Arabs | 76.0 /100 | #155 | Good 46.9% |
| Armenians | 75.4 /100 | #156 | Good 46.9% |
| Immigrants | Oceania | 74.8 /100 | #157 | Good 46.9% |
| Immigrants | Nonimmigrants | 73.3 /100 | #158 | Good 46.9% |
| Osage | 73.2 /100 | #159 | Good 46.9% |
| Iraqis | 71.7 /100 | #160 | Good 46.9% |
| Delaware | 71.2 /100 | #161 | Good 46.8% |
| Colombians | 71.0 /100 | #162 | Good 46.8% |
Demographics Similar to Lumbee by Married-couple Households
In terms of married-couple households, the demographic groups most similar to Lumbee are U.S. Virgin Islander (39.8%, a difference of 0.47%), Barbadian (39.4%, a difference of 0.50%), Immigrants from Dominica (39.4%, a difference of 0.57%), Pueblo (40.0%, a difference of 0.93%), and Immigrants from Barbados (39.2%, a difference of 1.0%).
| Demographics | Rating | Rank | Married-couple Households |
| West Indians | 0.0 /100 | #320 | Tragic 40.3% |
| Immigrants | Liberia | 0.0 /100 | #321 | Tragic 40.3% |
| Immigrants | Zaire | 0.0 /100 | #322 | Tragic 40.1% |
| Puerto Ricans | 0.0 /100 | #323 | Tragic 40.1% |
| Navajo | 0.0 /100 | #324 | Tragic 40.1% |
| Pueblo | 0.0 /100 | #325 | Tragic 40.0% |
| U.S. Virgin Islanders | 0.0 /100 | #326 | Tragic 39.8% |
| Lumbee | 0.0 /100 | #327 | Tragic 39.6% |
| Barbadians | 0.0 /100 | #328 | Tragic 39.4% |
| Immigrants | Dominica | 0.0 /100 | #329 | Tragic 39.4% |
| Immigrants | Barbados | 0.0 /100 | #330 | Tragic 39.2% |
| Immigrants | Congo | 0.0 /100 | #331 | Tragic 39.0% |
| Somalis | 0.0 /100 | #332 | Tragic 39.0% |
| Immigrants | West Indies | 0.0 /100 | #333 | Tragic 39.0% |
| Immigrants | St. Vincent and the Grenadines | 0.0 /100 | #334 | Tragic 38.7% |