Immigrants from Norway vs Lumbee Married-couple Households
COMPARE
Immigrants from Norway
Lumbee
Married-couple Households
Married-couple Households Comparison
Immigrants from Norway
Lumbee
46.5%
MARRIED-COUPLE HOUSEHOLDS
52.0/ 100
METRIC RATING
173rd/ 347
METRIC RANK
39.6%
MARRIED-COUPLE HOUSEHOLDS
0.0/ 100
METRIC RATING
327th/ 347
METRIC RANK
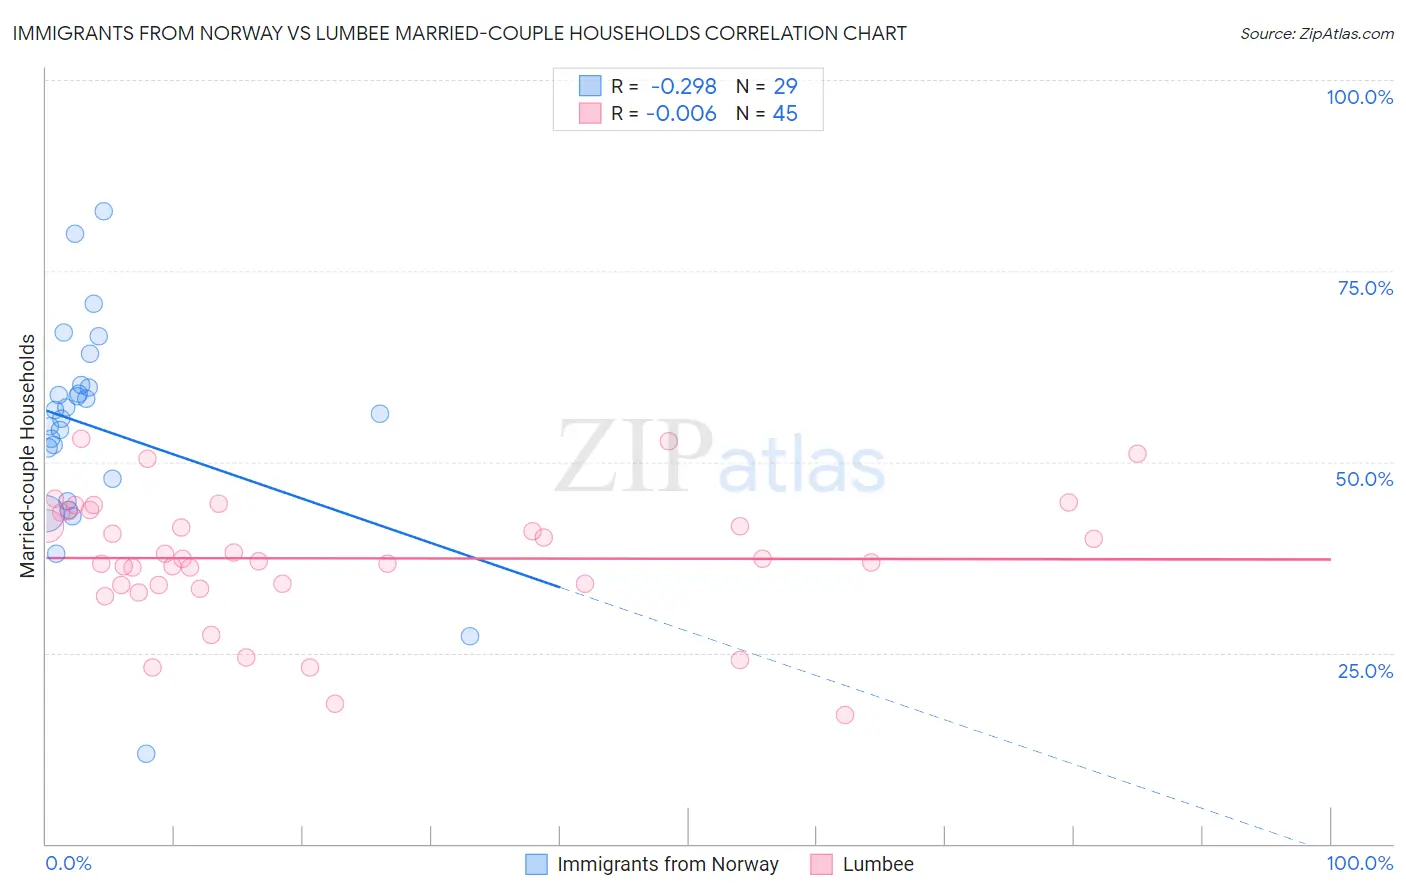
Immigrants from Norway vs Lumbee Married-couple Households Correlation Chart
The statistical analysis conducted on geographies consisting of 116,686,104 people shows a weak negative correlation between the proportion of Immigrants from Norway and percentage of married-couple family households in the United States with a correlation coefficient (R) of -0.298 and weighted average of 46.5%. Similarly, the statistical analysis conducted on geographies consisting of 92,264,260 people shows no correlation between the proportion of Lumbee and percentage of married-couple family households in the United States with a correlation coefficient (R) of -0.006 and weighted average of 39.6%, a difference of 17.4%.
Married-couple Households Correlation Summary
| Measurement | Immigrants from Norway | Lumbee |
| Minimum | 11.8% | 16.8% |
| Maximum | 82.8% | 53.0% |
| Range | 71.0% | 36.2% |
| Mean | 54.3% | 37.4% |
| Median | 56.2% | 37.3% |
| Interquartile 25% (IQ1) | 46.3% | 33.9% |
| Interquartile 75% (IQ3) | 59.8% | 43.5% |
| Interquartile Range (IQR) | 13.6% | 9.7% |
| Standard Deviation (Sample) | 14.2% | 8.3% |
| Standard Deviation (Population) | 13.9% | 8.2% |
Similar Demographics by Married-couple Households
Demographics Similar to Immigrants from Norway by Married-couple Households
In terms of married-couple households, the demographic groups most similar to Immigrants from Norway are Immigrants from Mexico (46.4%, a difference of 0.070%), Immigrants from Australia (46.5%, a difference of 0.10%), Immigrants from Chile (46.5%, a difference of 0.14%), Immigrants from Colombia (46.4%, a difference of 0.22%), and South American (46.6%, a difference of 0.23%).
| Demographics | Rating | Rank | Married-couple Households |
| Cherokee | 65.7 /100 | #166 | Good 46.7% |
| Immigrants | Croatia | 64.2 /100 | #167 | Good 46.7% |
| Israelis | 62.3 /100 | #168 | Good 46.7% |
| Spanish American Indians | 59.4 /100 | #169 | Average 46.6% |
| South Americans | 58.0 /100 | #170 | Average 46.6% |
| Immigrants | Chile | 55.7 /100 | #171 | Average 46.5% |
| Immigrants | Australia | 54.6 /100 | #172 | Average 46.5% |
| Immigrants | Norway | 52.0 /100 | #173 | Average 46.5% |
| Immigrants | Mexico | 50.0 /100 | #174 | Average 46.4% |
| Immigrants | Colombia | 46.1 /100 | #175 | Average 46.4% |
| Cajuns | 45.2 /100 | #176 | Average 46.4% |
| Immigrants | Immigrants | 43.8 /100 | #177 | Average 46.3% |
| Immigrants | Costa Rica | 43.4 /100 | #178 | Average 46.3% |
| Immigrants | Zimbabwe | 43.0 /100 | #179 | Average 46.3% |
| Mongolians | 42.0 /100 | #180 | Average 46.3% |
Demographics Similar to Lumbee by Married-couple Households
In terms of married-couple households, the demographic groups most similar to Lumbee are U.S. Virgin Islander (39.8%, a difference of 0.47%), Barbadian (39.4%, a difference of 0.50%), Immigrants from Dominica (39.4%, a difference of 0.57%), Pueblo (40.0%, a difference of 0.93%), and Immigrants from Barbados (39.2%, a difference of 1.0%).
| Demographics | Rating | Rank | Married-couple Households |
| West Indians | 0.0 /100 | #320 | Tragic 40.3% |
| Immigrants | Liberia | 0.0 /100 | #321 | Tragic 40.3% |
| Immigrants | Zaire | 0.0 /100 | #322 | Tragic 40.1% |
| Puerto Ricans | 0.0 /100 | #323 | Tragic 40.1% |
| Navajo | 0.0 /100 | #324 | Tragic 40.1% |
| Pueblo | 0.0 /100 | #325 | Tragic 40.0% |
| U.S. Virgin Islanders | 0.0 /100 | #326 | Tragic 39.8% |
| Lumbee | 0.0 /100 | #327 | Tragic 39.6% |
| Barbadians | 0.0 /100 | #328 | Tragic 39.4% |
| Immigrants | Dominica | 0.0 /100 | #329 | Tragic 39.4% |
| Immigrants | Barbados | 0.0 /100 | #330 | Tragic 39.2% |
| Immigrants | Congo | 0.0 /100 | #331 | Tragic 39.0% |
| Somalis | 0.0 /100 | #332 | Tragic 39.0% |
| Immigrants | West Indies | 0.0 /100 | #333 | Tragic 39.0% |
| Immigrants | St. Vincent and the Grenadines | 0.0 /100 | #334 | Tragic 38.7% |