Portuguese vs Immigrants from Cambodia Births to Unmarried Women
COMPARE
Portuguese
Immigrants from Cambodia
Births to Unmarried Women
Births to Unmarried Women Comparison
Portuguese
Immigrants from Cambodia
33.8%
BIRTHS TO UNMARRIED WOMEN
5.4/ 100
METRIC RATING
220th/ 347
METRIC RANK
34.8%
BIRTHS TO UNMARRIED WOMEN
1.6/ 100
METRIC RATING
238th/ 347
METRIC RANK
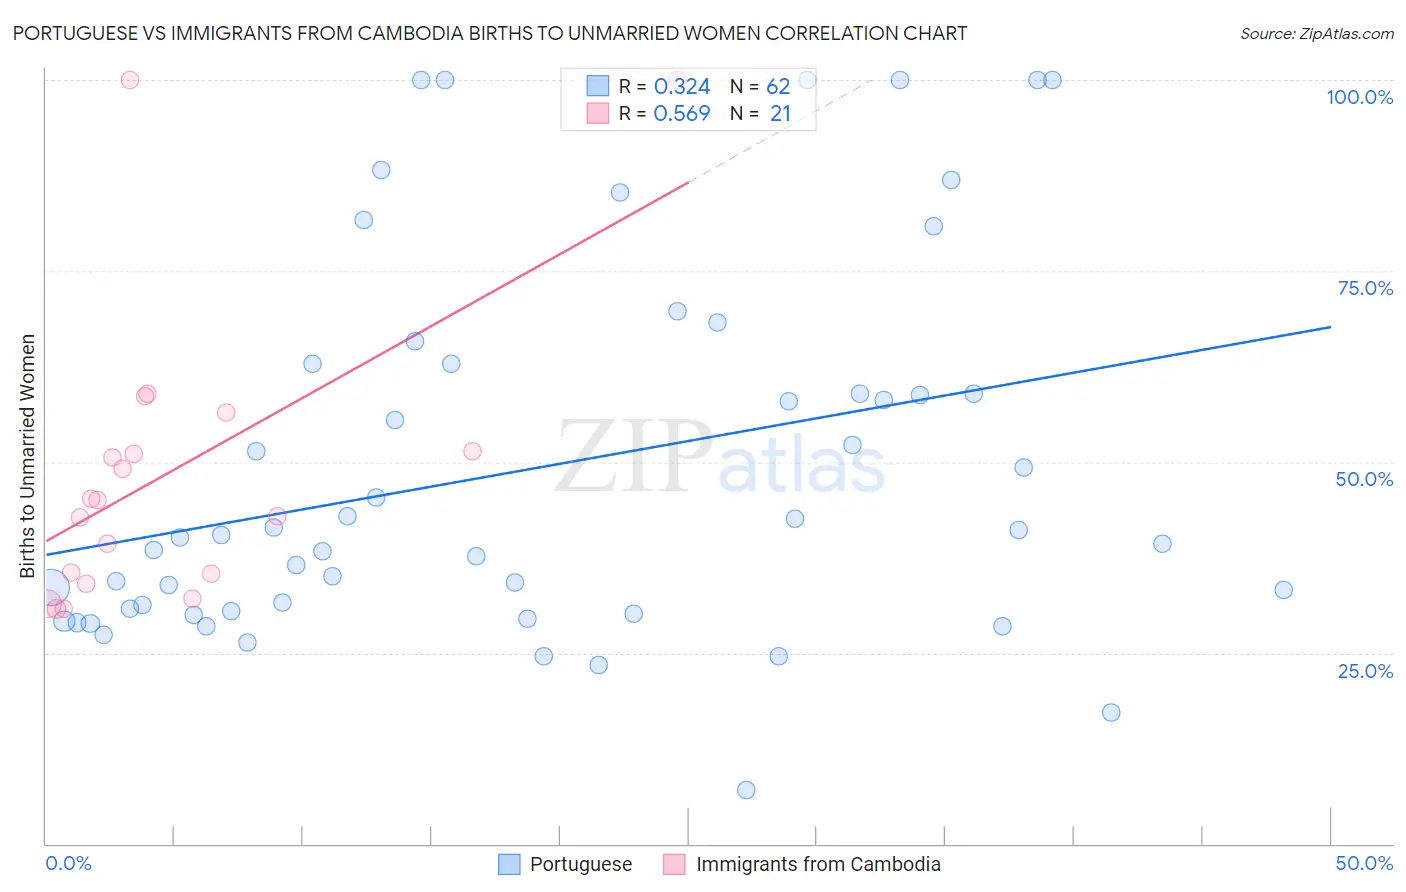
Portuguese vs Immigrants from Cambodia Births to Unmarried Women Correlation Chart
The statistical analysis conducted on geographies consisting of 413,543,833 people shows a mild positive correlation between the proportion of Portuguese and percentage of births to unmarried women in the United States with a correlation coefficient (R) of 0.324 and weighted average of 33.8%. Similarly, the statistical analysis conducted on geographies consisting of 198,809,651 people shows a substantial positive correlation between the proportion of Immigrants from Cambodia and percentage of births to unmarried women in the United States with a correlation coefficient (R) of 0.569 and weighted average of 34.8%, a difference of 2.8%.
Births to Unmarried Women Correlation Summary
| Measurement | Portuguese | Immigrants from Cambodia |
| Minimum | 7.1% | 30.7% |
| Maximum | 100.0% | 100.0% |
| Range | 92.9% | 69.3% |
| Mean | 49.2% | 48.6% |
| Median | 40.3% | 45.0% |
| Interquartile 25% (IQ1) | 30.5% | 34.6% |
| Interquartile 75% (IQ3) | 62.8% | 53.9% |
| Interquartile Range (IQR) | 32.3% | 19.3% |
| Standard Deviation (Sample) | 24.4% | 19.4% |
| Standard Deviation (Population) | 24.2% | 18.9% |
Demographics Similar to Portuguese and Immigrants from Cambodia by Births to Unmarried Women
In terms of births to unmarried women, the demographic groups most similar to Portuguese are Alsatian (33.8%, a difference of 0.020%), Malaysian (33.9%, a difference of 0.17%), Immigrants from Uruguay (33.9%, a difference of 0.24%), Pennsylvania German (34.0%, a difference of 0.53%), and Immigrants from Laos (34.0%, a difference of 0.53%). Similarly, the demographic groups most similar to Immigrants from Cambodia are Marshallese (34.8%, a difference of 0.060%), Immigrants from Cameroon (34.7%, a difference of 0.13%), Sierra Leonean (34.9%, a difference of 0.22%), Immigrants from Ghana (34.5%, a difference of 0.76%), and Immigrants from Zaire (34.5%, a difference of 0.83%).
| Demographics | Rating | Rank | Births to Unmarried Women |
| Alsatians | 5.4 /100 | #219 | Tragic 33.8% |
| Portuguese | 5.4 /100 | #220 | Tragic 33.8% |
| Malaysians | 5.0 /100 | #221 | Tragic 33.9% |
| Immigrants | Uruguay | 4.8 /100 | #222 | Tragic 33.9% |
| Pennsylvania Germans | 4.3 /100 | #223 | Tragic 34.0% |
| Immigrants | Laos | 4.3 /100 | #224 | Tragic 34.0% |
| Spanish | 4.0 /100 | #225 | Tragic 34.1% |
| Delaware | 3.3 /100 | #226 | Tragic 34.2% |
| Immigrants | Panama | 3.3 /100 | #227 | Tragic 34.2% |
| Panamanians | 3.3 /100 | #228 | Tragic 34.2% |
| Immigrants | Sierra Leone | 3.1 /100 | #229 | Tragic 34.2% |
| Ghanaians | 3.1 /100 | #230 | Tragic 34.3% |
| Native Hawaiians | 2.9 /100 | #231 | Tragic 34.3% |
| French Canadians | 2.5 /100 | #232 | Tragic 34.4% |
| Bangladeshis | 2.5 /100 | #233 | Tragic 34.4% |
| Immigrants | Zaire | 2.3 /100 | #234 | Tragic 34.5% |
| Immigrants | Ghana | 2.2 /100 | #235 | Tragic 34.5% |
| Immigrants | Cameroon | 1.6 /100 | #236 | Tragic 34.7% |
| Marshallese | 1.6 /100 | #237 | Tragic 34.8% |
| Immigrants | Cambodia | 1.6 /100 | #238 | Tragic 34.8% |
| Sierra Leoneans | 1.4 /100 | #239 | Tragic 34.9% |