Spaniard vs European Births to Unmarried Women
COMPARE
Spaniard
European
Births to Unmarried Women
Births to Unmarried Women Comparison
Spaniards
Europeans
33.6%
BIRTHS TO UNMARRIED WOMEN
7.0/ 100
METRIC RATING
217th/ 347
METRIC RANK
30.2%
BIRTHS TO UNMARRIED WOMEN
87.2/ 100
METRIC RATING
126th/ 347
METRIC RANK
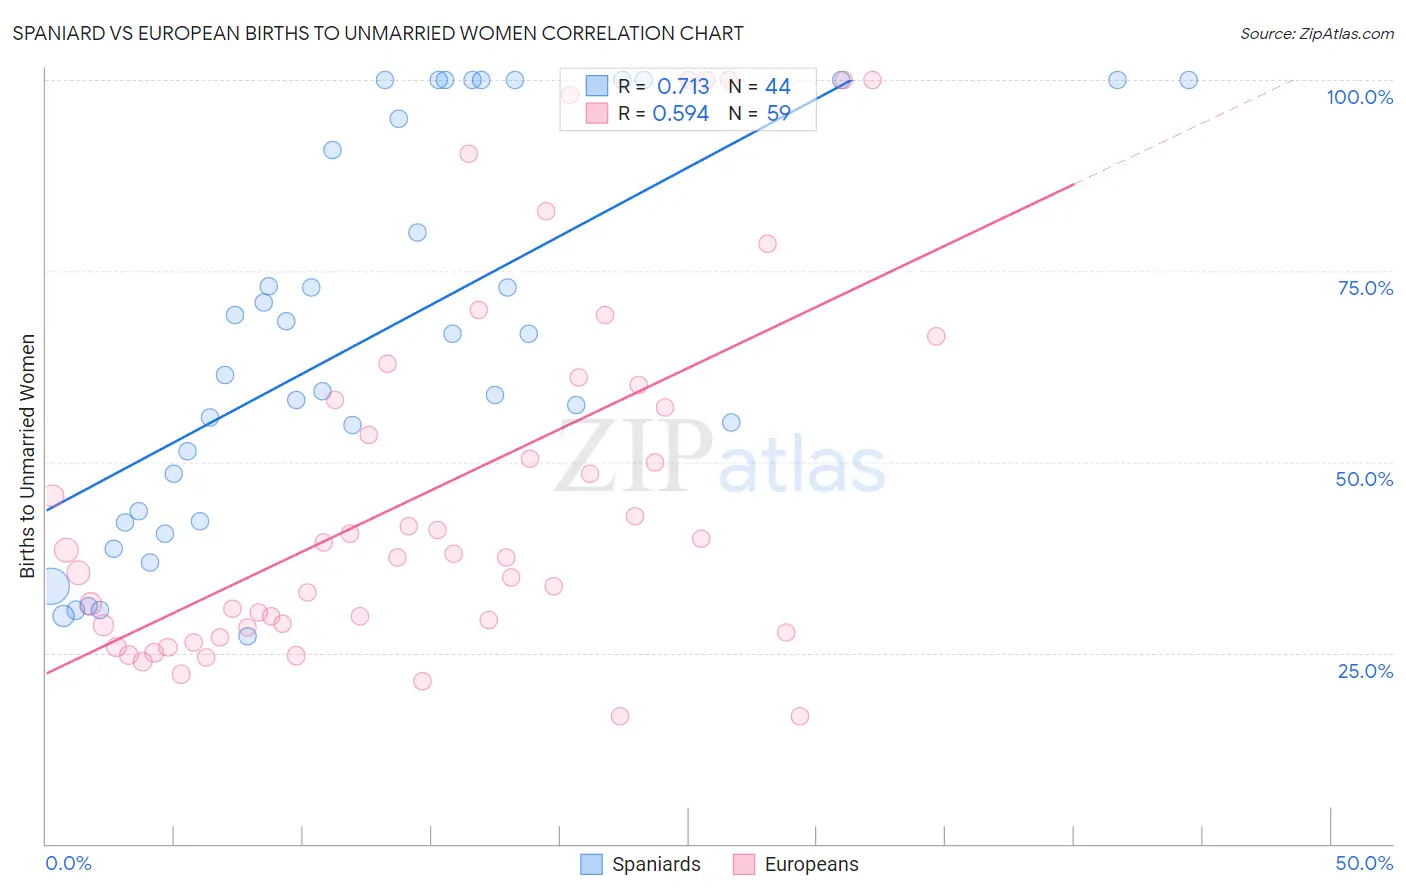
Spaniard vs European Births to Unmarried Women Correlation Chart
The statistical analysis conducted on geographies consisting of 411,709,263 people shows a strong positive correlation between the proportion of Spaniards and percentage of births to unmarried women in the United States with a correlation coefficient (R) of 0.713 and weighted average of 33.6%. Similarly, the statistical analysis conducted on geographies consisting of 499,777,357 people shows a substantial positive correlation between the proportion of Europeans and percentage of births to unmarried women in the United States with a correlation coefficient (R) of 0.594 and weighted average of 30.2%, a difference of 11.2%.
Births to Unmarried Women Correlation Summary
| Measurement | Spaniard | European |
| Minimum | 27.1% | 16.7% |
| Maximum | 100.0% | 100.0% |
| Range | 72.9% | 83.3% |
| Mean | 66.2% | 46.4% |
| Median | 64.1% | 38.0% |
| Interquartile 25% (IQ1) | 42.9% | 28.3% |
| Interquartile 75% (IQ3) | 97.4% | 60.0% |
| Interquartile Range (IQR) | 54.5% | 31.7% |
| Standard Deviation (Sample) | 25.1% | 24.5% |
| Standard Deviation (Population) | 24.8% | 24.3% |
Similar Demographics by Births to Unmarried Women
Demographics Similar to Spaniards by Births to Unmarried Women
In terms of births to unmarried women, the demographic groups most similar to Spaniards are Nepalese (33.5%, a difference of 0.24%), Immigrants from Ecuador (33.7%, a difference of 0.40%), French (33.4%, a difference of 0.51%), Alsatian (33.8%, a difference of 0.62%), and Portuguese (33.8%, a difference of 0.64%).
| Demographics | Rating | Rank | Births to Unmarried Women |
| Scotch-Irish | 10.7 /100 | #210 | Poor 33.3% |
| Ecuadorians | 10.5 /100 | #211 | Poor 33.3% |
| Celtics | 10.2 /100 | #212 | Poor 33.3% |
| Immigrants | Costa Rica | 9.5 /100 | #213 | Tragic 33.4% |
| Slovaks | 9.3 /100 | #214 | Tragic 33.4% |
| French | 8.7 /100 | #215 | Tragic 33.4% |
| Nepalese | 7.8 /100 | #216 | Tragic 33.5% |
| Spaniards | 7.0 /100 | #217 | Tragic 33.6% |
| Immigrants | Ecuador | 5.9 /100 | #218 | Tragic 33.7% |
| Alsatians | 5.4 /100 | #219 | Tragic 33.8% |
| Portuguese | 5.4 /100 | #220 | Tragic 33.8% |
| Malaysians | 5.0 /100 | #221 | Tragic 33.9% |
| Immigrants | Uruguay | 4.8 /100 | #222 | Tragic 33.9% |
| Pennsylvania Germans | 4.3 /100 | #223 | Tragic 34.0% |
| Immigrants | Laos | 4.3 /100 | #224 | Tragic 34.0% |
Demographics Similar to Europeans by Births to Unmarried Women
In terms of births to unmarried women, the demographic groups most similar to Europeans are Chinese (30.2%, a difference of 0.030%), Vietnamese (30.2%, a difference of 0.12%), Croatian (30.2%, a difference of 0.19%), Syrian (30.2%, a difference of 0.23%), and Icelander (30.3%, a difference of 0.27%).
| Demographics | Rating | Rank | Births to Unmarried Women |
| Argentineans | 90.5 /100 | #119 | Exceptional 30.0% |
| Ugandans | 89.2 /100 | #120 | Excellent 30.1% |
| Koreans | 88.9 /100 | #121 | Excellent 30.1% |
| Immigrants | Argentina | 88.7 /100 | #122 | Excellent 30.1% |
| Syrians | 88.2 /100 | #123 | Excellent 30.2% |
| Croatians | 88.0 /100 | #124 | Excellent 30.2% |
| Vietnamese | 87.7 /100 | #125 | Excellent 30.2% |
| Europeans | 87.2 /100 | #126 | Excellent 30.2% |
| Chinese | 87.1 /100 | #127 | Excellent 30.2% |
| Icelanders | 86.0 /100 | #128 | Excellent 30.3% |
| Immigrants | Spain | 85.8 /100 | #129 | Excellent 30.3% |
| Immigrants | Bosnia and Herzegovina | 85.7 /100 | #130 | Excellent 30.3% |
| Immigrants | Zimbabwe | 85.7 /100 | #131 | Excellent 30.3% |
| New Zealanders | 85.5 /100 | #132 | Excellent 30.3% |
| Immigrants | Morocco | 85.2 /100 | #133 | Excellent 30.4% |