Immigrants from England vs Immigrants from Cambodia Births to Unmarried Women
COMPARE
Immigrants from England
Immigrants from Cambodia
Births to Unmarried Women
Births to Unmarried Women Comparison
Immigrants from England
Immigrants from Cambodia
31.1%
BIRTHS TO UNMARRIED WOMEN
69.4/ 100
METRIC RATING
159th/ 347
METRIC RANK
34.8%
BIRTHS TO UNMARRIED WOMEN
1.6/ 100
METRIC RATING
238th/ 347
METRIC RANK
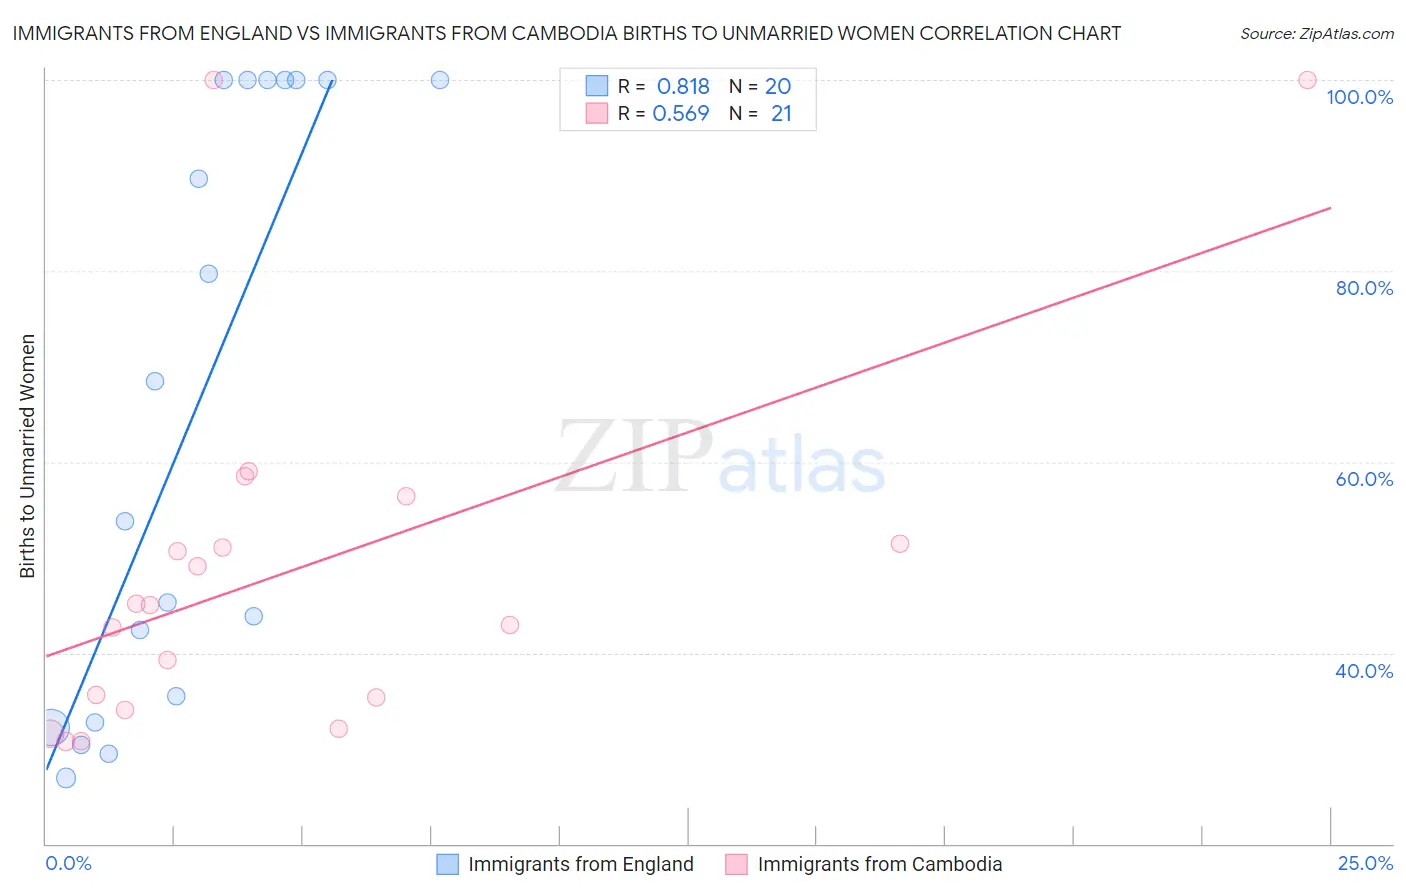
Immigrants from England vs Immigrants from Cambodia Births to Unmarried Women Correlation Chart
The statistical analysis conducted on geographies consisting of 362,448,149 people shows a very strong positive correlation between the proportion of Immigrants from England and percentage of births to unmarried women in the United States with a correlation coefficient (R) of 0.818 and weighted average of 31.1%. Similarly, the statistical analysis conducted on geographies consisting of 198,809,651 people shows a substantial positive correlation between the proportion of Immigrants from Cambodia and percentage of births to unmarried women in the United States with a correlation coefficient (R) of 0.569 and weighted average of 34.8%, a difference of 12.0%.
Births to Unmarried Women Correlation Summary
| Measurement | Immigrants from England | Immigrants from Cambodia |
| Minimum | 26.9% | 30.7% |
| Maximum | 100.0% | 100.0% |
| Range | 73.1% | 69.3% |
| Mean | 65.5% | 48.6% |
| Median | 61.1% | 45.0% |
| Interquartile 25% (IQ1) | 34.1% | 34.6% |
| Interquartile 75% (IQ3) | 100.0% | 53.9% |
| Interquartile Range (IQR) | 65.9% | 19.3% |
| Standard Deviation (Sample) | 30.6% | 19.4% |
| Standard Deviation (Population) | 29.8% | 18.9% |
Similar Demographics by Births to Unmarried Women
Demographics Similar to Immigrants from England by Births to Unmarried Women
In terms of births to unmarried women, the demographic groups most similar to Immigrants from England are Immigrants from Western Europe (31.1%, a difference of 0.0%), Austrian (31.0%, a difference of 0.060%), Immigrants from Southern Europe (31.1%, a difference of 0.070%), Immigrants from Eastern Africa (31.0%, a difference of 0.32%), and Slovene (31.2%, a difference of 0.38%).
| Demographics | Rating | Rank | Births to Unmarried Women |
| Poles | 76.2 /100 | #152 | Good 30.8% |
| British | 76.0 /100 | #153 | Good 30.8% |
| Yugoslavians | 75.1 /100 | #154 | Good 30.8% |
| Immigrants | Bangladesh | 73.9 /100 | #155 | Good 30.9% |
| Carpatho Rusyns | 73.5 /100 | #156 | Good 30.9% |
| Immigrants | Eastern Africa | 72.1 /100 | #157 | Good 31.0% |
| Austrians | 69.9 /100 | #158 | Good 31.0% |
| Immigrants | England | 69.4 /100 | #159 | Good 31.1% |
| Immigrants | Western Europe | 69.3 /100 | #160 | Good 31.1% |
| Immigrants | Southern Europe | 68.7 /100 | #161 | Good 31.1% |
| Slovenes | 65.9 /100 | #162 | Good 31.2% |
| Immigrants | Chile | 65.7 /100 | #163 | Good 31.2% |
| Hungarians | 64.1 /100 | #164 | Good 31.2% |
| Immigrants | Somalia | 58.1 /100 | #165 | Average 31.4% |
| Peruvians | 55.5 /100 | #166 | Average 31.5% |
Demographics Similar to Immigrants from Cambodia by Births to Unmarried Women
In terms of births to unmarried women, the demographic groups most similar to Immigrants from Cambodia are Marshallese (34.8%, a difference of 0.060%), Immigrants from Cameroon (34.7%, a difference of 0.13%), Sierra Leonean (34.9%, a difference of 0.22%), Immigrants from Middle Africa (34.9%, a difference of 0.47%), and Immigrants from Guyana (35.0%, a difference of 0.51%).
| Demographics | Rating | Rank | Births to Unmarried Women |
| Native Hawaiians | 2.9 /100 | #231 | Tragic 34.3% |
| French Canadians | 2.5 /100 | #232 | Tragic 34.4% |
| Bangladeshis | 2.5 /100 | #233 | Tragic 34.4% |
| Immigrants | Zaire | 2.3 /100 | #234 | Tragic 34.5% |
| Immigrants | Ghana | 2.2 /100 | #235 | Tragic 34.5% |
| Immigrants | Cameroon | 1.6 /100 | #236 | Tragic 34.7% |
| Marshallese | 1.6 /100 | #237 | Tragic 34.8% |
| Immigrants | Cambodia | 1.6 /100 | #238 | Tragic 34.8% |
| Sierra Leoneans | 1.4 /100 | #239 | Tragic 34.9% |
| Immigrants | Middle Africa | 1.2 /100 | #240 | Tragic 34.9% |
| Immigrants | Guyana | 1.2 /100 | #241 | Tragic 35.0% |
| Indonesians | 1.2 /100 | #242 | Tragic 35.0% |
| Japanese | 0.9 /100 | #243 | Tragic 35.2% |
| Guyanese | 0.9 /100 | #244 | Tragic 35.2% |
| Shoshone | 0.8 /100 | #245 | Tragic 35.3% |