Spaniard vs Paiute Births to Unmarried Women
COMPARE
Spaniard
Paiute
Births to Unmarried Women
Births to Unmarried Women Comparison
Spaniards
Paiute
33.6%
BIRTHS TO UNMARRIED WOMEN
7.0/ 100
METRIC RATING
217th/ 347
METRIC RANK
42.5%
BIRTHS TO UNMARRIED WOMEN
0.0/ 100
METRIC RATING
329th/ 347
METRIC RANK
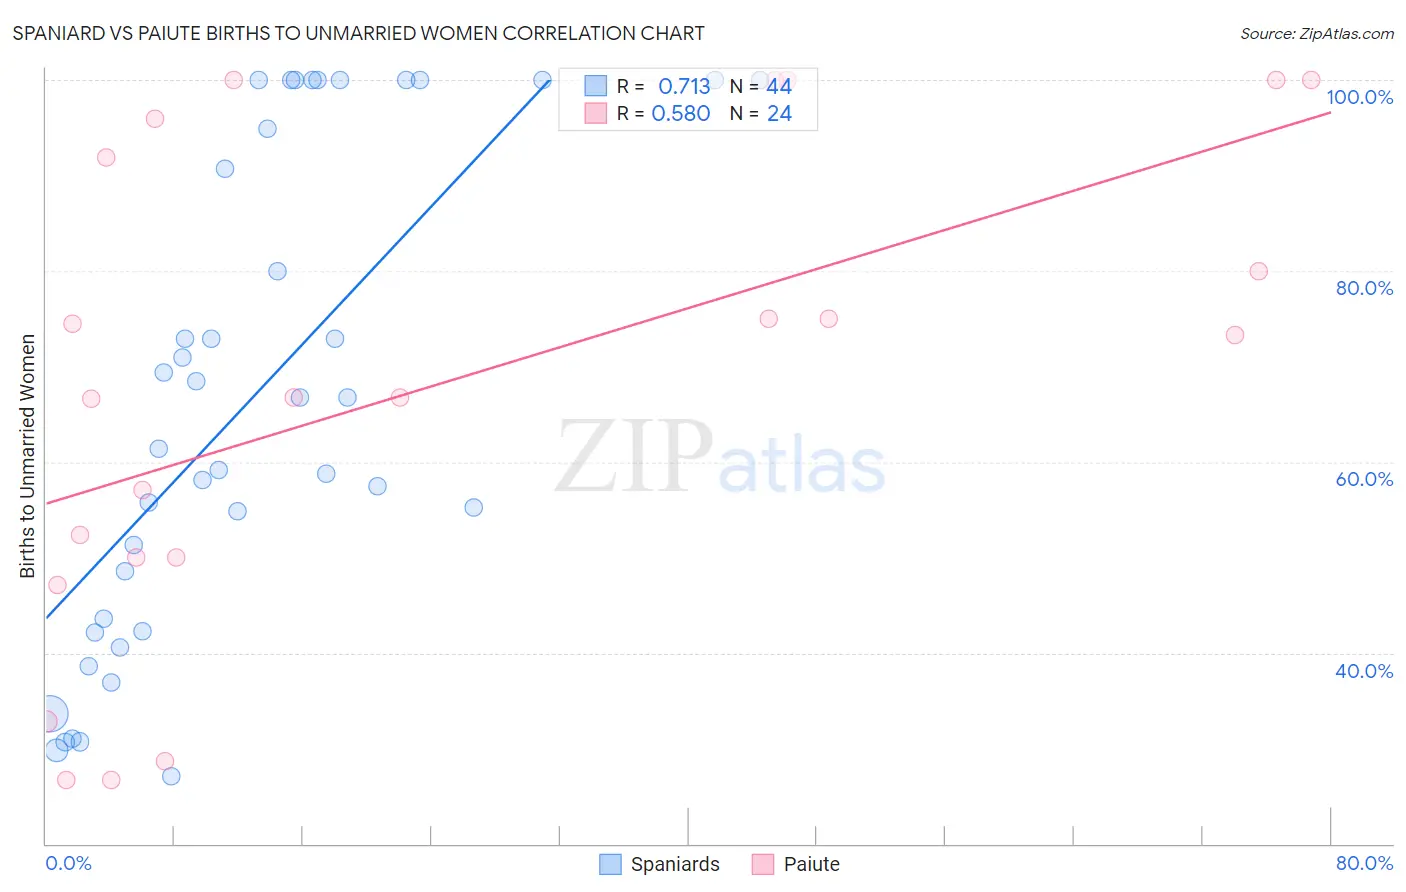
Spaniard vs Paiute Births to Unmarried Women Correlation Chart
The statistical analysis conducted on geographies consisting of 411,709,263 people shows a strong positive correlation between the proportion of Spaniards and percentage of births to unmarried women in the United States with a correlation coefficient (R) of 0.713 and weighted average of 33.6%. Similarly, the statistical analysis conducted on geographies consisting of 57,331,640 people shows a substantial positive correlation between the proportion of Paiute and percentage of births to unmarried women in the United States with a correlation coefficient (R) of 0.580 and weighted average of 42.5%, a difference of 26.4%.
Births to Unmarried Women Correlation Summary
| Measurement | Spaniard | Paiute |
| Minimum | 27.1% | 26.6% |
| Maximum | 100.0% | 100.0% |
| Range | 72.9% | 73.4% |
| Mean | 66.2% | 68.2% |
| Median | 64.1% | 70.0% |
| Interquartile 25% (IQ1) | 42.9% | 50.0% |
| Interquartile 75% (IQ3) | 97.4% | 93.9% |
| Interquartile Range (IQR) | 54.5% | 43.9% |
| Standard Deviation (Sample) | 25.1% | 25.1% |
| Standard Deviation (Population) | 24.8% | 24.5% |
Similar Demographics by Births to Unmarried Women
Demographics Similar to Spaniards by Births to Unmarried Women
In terms of births to unmarried women, the demographic groups most similar to Spaniards are Nepalese (33.5%, a difference of 0.24%), Immigrants from Ecuador (33.7%, a difference of 0.40%), French (33.4%, a difference of 0.51%), Alsatian (33.8%, a difference of 0.62%), and Portuguese (33.8%, a difference of 0.64%).
| Demographics | Rating | Rank | Births to Unmarried Women |
| Scotch-Irish | 10.7 /100 | #210 | Poor 33.3% |
| Ecuadorians | 10.5 /100 | #211 | Poor 33.3% |
| Celtics | 10.2 /100 | #212 | Poor 33.3% |
| Immigrants | Costa Rica | 9.5 /100 | #213 | Tragic 33.4% |
| Slovaks | 9.3 /100 | #214 | Tragic 33.4% |
| French | 8.7 /100 | #215 | Tragic 33.4% |
| Nepalese | 7.8 /100 | #216 | Tragic 33.5% |
| Spaniards | 7.0 /100 | #217 | Tragic 33.6% |
| Immigrants | Ecuador | 5.9 /100 | #218 | Tragic 33.7% |
| Alsatians | 5.4 /100 | #219 | Tragic 33.8% |
| Portuguese | 5.4 /100 | #220 | Tragic 33.8% |
| Malaysians | 5.0 /100 | #221 | Tragic 33.9% |
| Immigrants | Uruguay | 4.8 /100 | #222 | Tragic 33.9% |
| Pennsylvania Germans | 4.3 /100 | #223 | Tragic 34.0% |
| Immigrants | Laos | 4.3 /100 | #224 | Tragic 34.0% |
Demographics Similar to Paiute by Births to Unmarried Women
In terms of births to unmarried women, the demographic groups most similar to Paiute are Chippewa (42.6%, a difference of 0.40%), Immigrants from Cabo Verde (42.2%, a difference of 0.60%), Tsimshian (42.2%, a difference of 0.74%), Native/Alaskan (43.0%, a difference of 1.2%), and Kiowa (43.1%, a difference of 1.6%).
| Demographics | Rating | Rank | Births to Unmarried Women |
| Cajuns | 0.0 /100 | #322 | Tragic 41.0% |
| Sioux | 0.0 /100 | #323 | Tragic 41.0% |
| Cape Verdeans | 0.0 /100 | #324 | Tragic 41.3% |
| Cheyenne | 0.0 /100 | #325 | Tragic 41.3% |
| Immigrants | Cuba | 0.0 /100 | #326 | Tragic 41.5% |
| Tsimshian | 0.0 /100 | #327 | Tragic 42.2% |
| Immigrants | Cabo Verde | 0.0 /100 | #328 | Tragic 42.2% |
| Paiute | 0.0 /100 | #329 | Tragic 42.5% |
| Chippewa | 0.0 /100 | #330 | Tragic 42.6% |
| Natives/Alaskans | 0.0 /100 | #331 | Tragic 43.0% |
| Kiowa | 0.0 /100 | #332 | Tragic 43.1% |
| Blacks/African Americans | 0.0 /100 | #333 | Tragic 44.3% |
| Yuman | 0.0 /100 | #334 | Tragic 44.4% |
| Colville | 0.0 /100 | #335 | Tragic 45.3% |
| Puerto Ricans | 0.0 /100 | #336 | Tragic 45.7% |