Immigrants from Grenada vs Immigrants from Cambodia Births to Unmarried Women
COMPARE
Immigrants from Grenada
Immigrants from Cambodia
Births to Unmarried Women
Births to Unmarried Women Comparison
Immigrants from Grenada
Immigrants from Cambodia
36.3%
BIRTHS TO UNMARRIED WOMEN
0.2/ 100
METRIC RATING
257th/ 347
METRIC RANK
34.8%
BIRTHS TO UNMARRIED WOMEN
1.6/ 100
METRIC RATING
238th/ 347
METRIC RANK
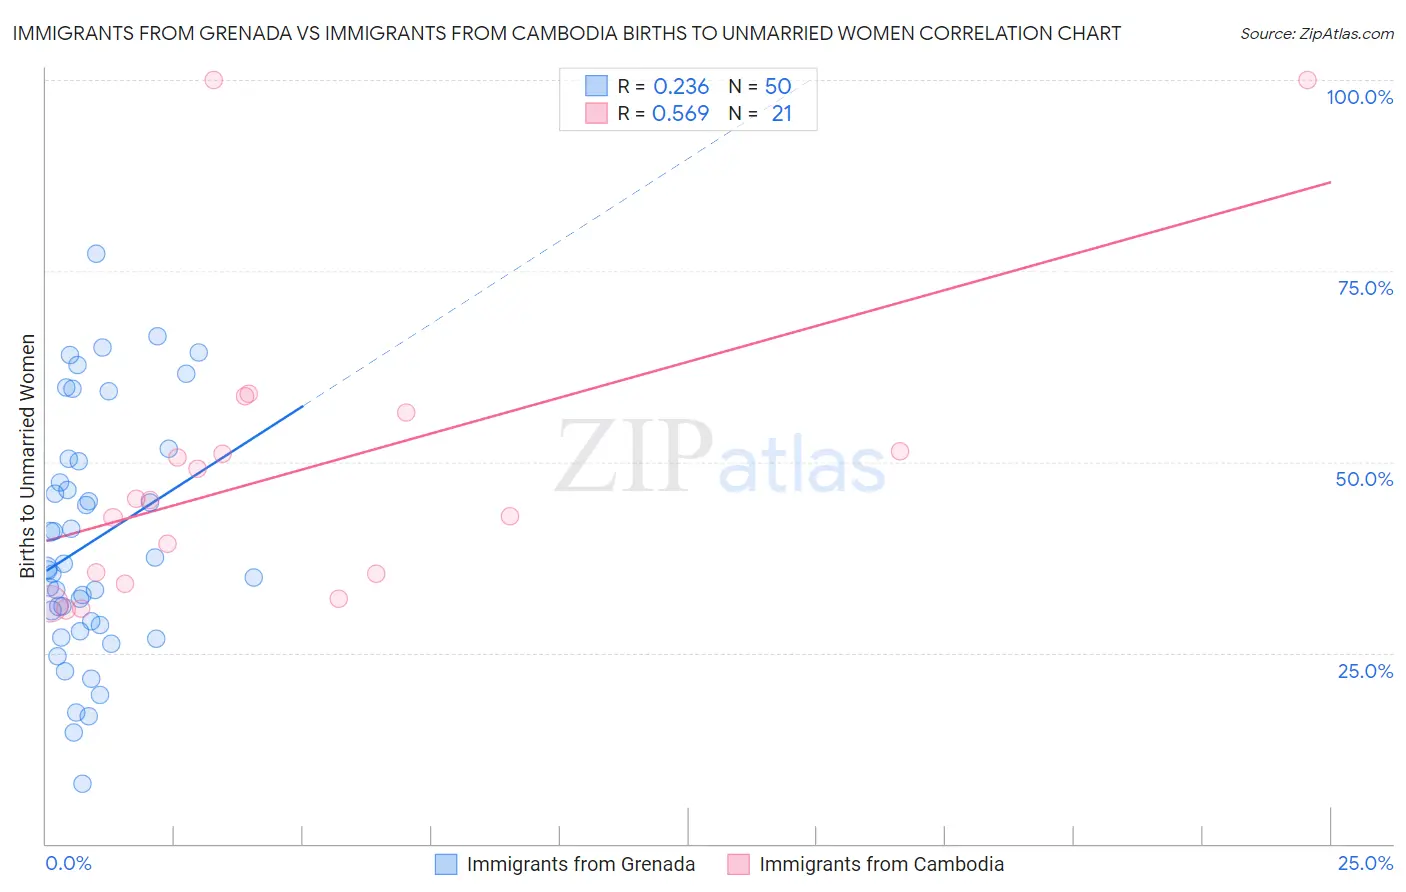
Immigrants from Grenada vs Immigrants from Cambodia Births to Unmarried Women Correlation Chart
The statistical analysis conducted on geographies consisting of 66,381,769 people shows a weak positive correlation between the proportion of Immigrants from Grenada and percentage of births to unmarried women in the United States with a correlation coefficient (R) of 0.236 and weighted average of 36.3%. Similarly, the statistical analysis conducted on geographies consisting of 198,809,651 people shows a substantial positive correlation between the proportion of Immigrants from Cambodia and percentage of births to unmarried women in the United States with a correlation coefficient (R) of 0.569 and weighted average of 34.8%, a difference of 4.4%.
Births to Unmarried Women Correlation Summary
| Measurement | Immigrants from Grenada | Immigrants from Cambodia |
| Minimum | 7.9% | 30.7% |
| Maximum | 77.2% | 100.0% |
| Range | 69.3% | 69.3% |
| Mean | 39.4% | 48.6% |
| Median | 36.0% | 45.0% |
| Interquartile 25% (IQ1) | 28.6% | 34.6% |
| Interquartile 75% (IQ3) | 50.1% | 53.9% |
| Interquartile Range (IQR) | 21.5% | 19.3% |
| Standard Deviation (Sample) | 15.7% | 19.4% |
| Standard Deviation (Population) | 15.6% | 18.9% |
Demographics Similar to Immigrants from Grenada and Immigrants from Cambodia by Births to Unmarried Women
In terms of births to unmarried women, the demographic groups most similar to Immigrants from Grenada are Chickasaw (36.3%, a difference of 0.030%), Immigrants from Trinidad and Tobago (36.3%, a difference of 0.030%), Potawatomi (36.2%, a difference of 0.16%), Immigrants from Portugal (36.2%, a difference of 0.39%), and Salvadoran (36.0%, a difference of 0.85%). Similarly, the demographic groups most similar to Immigrants from Cambodia are Marshallese (34.8%, a difference of 0.060%), Sierra Leonean (34.9%, a difference of 0.22%), Immigrants from Middle Africa (34.9%, a difference of 0.47%), Immigrants from Guyana (35.0%, a difference of 0.51%), and Indonesian (35.0%, a difference of 0.61%).
| Demographics | Rating | Rank | Births to Unmarried Women |
| Marshallese | 1.6 /100 | #237 | Tragic 34.8% |
| Immigrants | Cambodia | 1.6 /100 | #238 | Tragic 34.8% |
| Sierra Leoneans | 1.4 /100 | #239 | Tragic 34.9% |
| Immigrants | Middle Africa | 1.2 /100 | #240 | Tragic 34.9% |
| Immigrants | Guyana | 1.2 /100 | #241 | Tragic 35.0% |
| Indonesians | 1.2 /100 | #242 | Tragic 35.0% |
| Japanese | 0.9 /100 | #243 | Tragic 35.2% |
| Guyanese | 0.9 /100 | #244 | Tragic 35.2% |
| Shoshone | 0.8 /100 | #245 | Tragic 35.3% |
| Nigerians | 0.7 /100 | #246 | Tragic 35.3% |
| Immigrants | Nigeria | 0.7 /100 | #247 | Tragic 35.4% |
| Immigrants | Nonimmigrants | 0.6 /100 | #248 | Tragic 35.5% |
| Bermudans | 0.6 /100 | #249 | Tragic 35.5% |
| Mexican American Indians | 0.4 /100 | #250 | Tragic 35.7% |
| Immigrants | Western Africa | 0.3 /100 | #251 | Tragic 36.0% |
| Salvadorans | 0.3 /100 | #252 | Tragic 36.0% |
| Immigrants | Portugal | 0.2 /100 | #253 | Tragic 36.2% |
| Potawatomi | 0.2 /100 | #254 | Tragic 36.2% |
| Chickasaw | 0.2 /100 | #255 | Tragic 36.3% |
| Immigrants | Trinidad and Tobago | 0.2 /100 | #256 | Tragic 36.3% |
| Immigrants | Grenada | 0.2 /100 | #257 | Tragic 36.3% |