Serbian vs Immigrants from Senegal Average Family Size
COMPARE
Serbian
Immigrants from Senegal
Average Family Size
Average Family Size Comparison
Serbians
Immigrants from Senegal
3.12
AVERAGE FAMILY SIZE
0.1/ 100
METRIC RATING
316th/ 347
METRIC RANK
3.23
AVERAGE FAMILY SIZE
57.5/ 100
METRIC RATING
166th/ 347
METRIC RANK
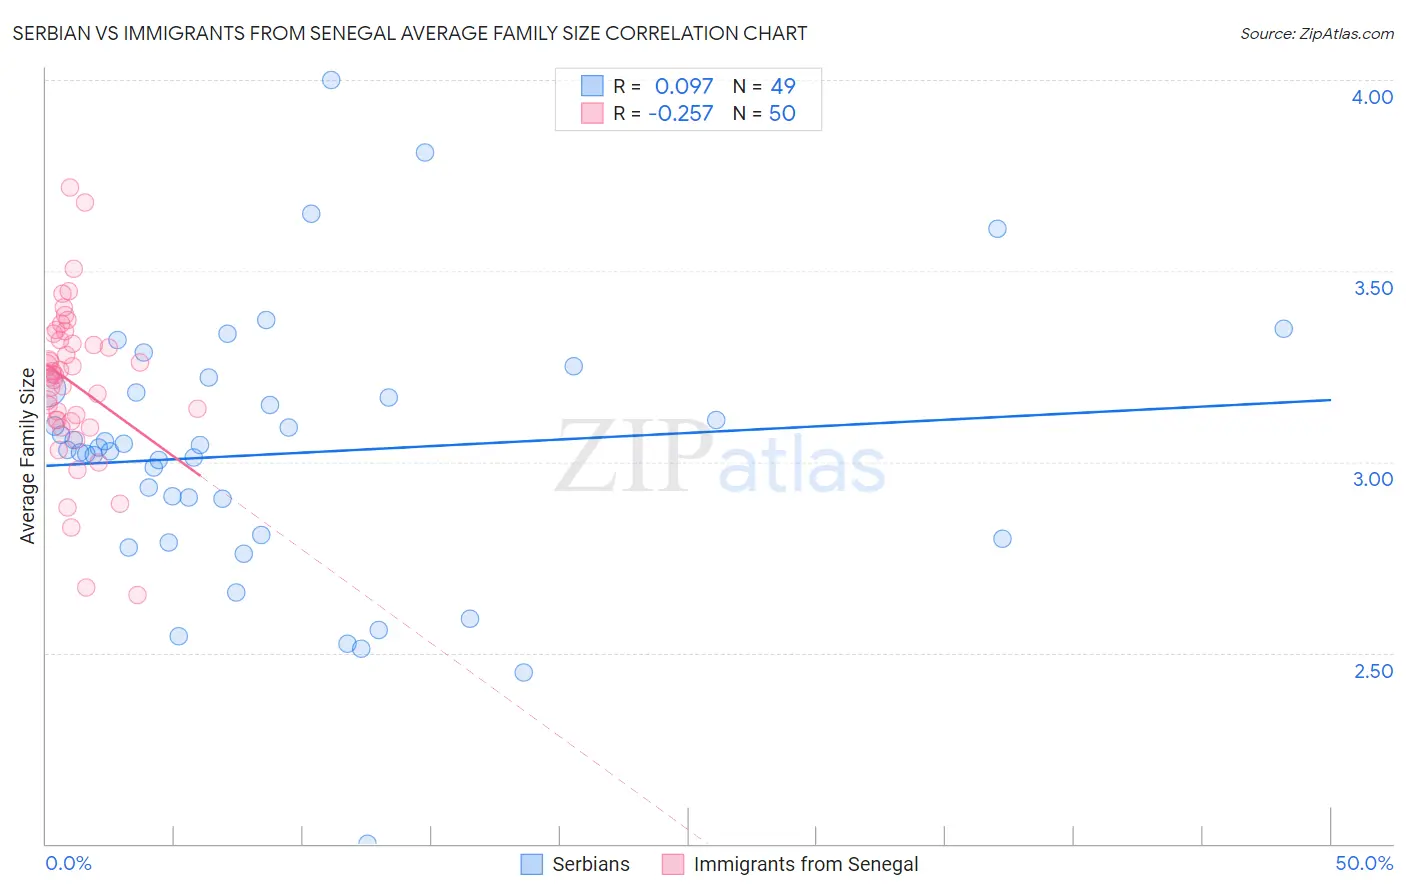
Serbian vs Immigrants from Senegal Average Family Size Correlation Chart
The statistical analysis conducted on geographies consisting of 267,532,826 people shows a slight positive correlation between the proportion of Serbians and average family size in the United States with a correlation coefficient (R) of 0.097 and weighted average of 3.12. Similarly, the statistical analysis conducted on geographies consisting of 90,123,819 people shows a weak negative correlation between the proportion of Immigrants from Senegal and average family size in the United States with a correlation coefficient (R) of -0.257 and weighted average of 3.23, a difference of 3.6%.
Average Family Size Correlation Summary
| Measurement | Serbian | Immigrants from Senegal |
| Minimum | 2.00 | 2.65 |
| Maximum | 4.00 | 3.72 |
| Range | 2.00 | 1.07 |
| Mean | 3.02 | 3.21 |
| Median | 3.03 | 3.23 |
| Interquartile 25% (IQ1) | 2.81 | 3.11 |
| Interquartile 75% (IQ3) | 3.19 | 3.32 |
| Interquartile Range (IQR) | 0.38 | 0.21 |
| Standard Deviation (Sample) | 0.35 | 0.21 |
| Standard Deviation (Population) | 0.35 | 0.21 |
Similar Demographics by Average Family Size
Demographics Similar to Serbians by Average Family Size
In terms of average family size, the demographic groups most similar to Serbians are Italian (3.12, a difference of 0.060%), Eastern European (3.12, a difference of 0.070%), Welsh (3.12, a difference of 0.070%), Immigrants from Scotland (3.12, a difference of 0.090%), and Russian (3.12, a difference of 0.11%).
| Demographics | Rating | Rank | Average Family Size |
| Northern Europeans | 0.1 /100 | #309 | Tragic 3.13 |
| Czechoslovakians | 0.1 /100 | #310 | Tragic 3.13 |
| Immigrants | Northern Europe | 0.1 /100 | #311 | Tragic 3.13 |
| Immigrants | Australia | 0.1 /100 | #312 | Tragic 3.13 |
| Bulgarians | 0.1 /100 | #313 | Tragic 3.13 |
| Russians | 0.1 /100 | #314 | Tragic 3.12 |
| Immigrants | Scotland | 0.1 /100 | #315 | Tragic 3.12 |
| Serbians | 0.1 /100 | #316 | Tragic 3.12 |
| Italians | 0.1 /100 | #317 | Tragic 3.12 |
| Eastern Europeans | 0.1 /100 | #318 | Tragic 3.12 |
| Welsh | 0.1 /100 | #319 | Tragic 3.12 |
| Immigrants | North America | 0.0 /100 | #320 | Tragic 3.12 |
| Immigrants | Austria | 0.0 /100 | #321 | Tragic 3.12 |
| Immigrants | Canada | 0.0 /100 | #322 | Tragic 3.12 |
| Soviet Union | 0.0 /100 | #323 | Tragic 3.11 |
Demographics Similar to Immigrants from Senegal by Average Family Size
In terms of average family size, the demographic groups most similar to Immigrants from Senegal are Dutch West Indian (3.23, a difference of 0.010%), Egyptian (3.23, a difference of 0.020%), Ugandan (3.23, a difference of 0.020%), Uruguayan (3.23, a difference of 0.030%), and Immigrants from Uganda (3.23, a difference of 0.050%).
| Demographics | Rating | Rank | Average Family Size |
| Ethiopians | 63.9 /100 | #159 | Good 3.24 |
| Immigrants | Iraq | 63.7 /100 | #160 | Good 3.24 |
| Immigrants | Chile | 63.2 /100 | #161 | Good 3.24 |
| Immigrants | Uganda | 60.1 /100 | #162 | Good 3.23 |
| Uruguayans | 58.8 /100 | #163 | Average 3.23 |
| Egyptians | 58.6 /100 | #164 | Average 3.23 |
| Ugandans | 58.4 /100 | #165 | Average 3.23 |
| Immigrants | Senegal | 57.5 /100 | #166 | Average 3.23 |
| Dutch West Indians | 56.9 /100 | #167 | Average 3.23 |
| Taiwanese | 54.2 /100 | #168 | Average 3.23 |
| Aleuts | 54.1 /100 | #169 | Average 3.23 |
| Arabs | 53.8 /100 | #170 | Average 3.23 |
| Chileans | 53.2 /100 | #171 | Average 3.23 |
| Immigrants | Congo | 52.7 /100 | #172 | Average 3.23 |
| Immigrants | Uruguay | 52.0 /100 | #173 | Average 3.23 |