Serbian vs Seminole Average Family Size
COMPARE
Serbian
Seminole
Average Family Size
Average Family Size Comparison
Serbians
Seminole
3.12
AVERAGE FAMILY SIZE
0.1/ 100
METRIC RATING
316th/ 347
METRIC RANK
3.24
AVERAGE FAMILY SIZE
68.2/ 100
METRIC RATING
155th/ 347
METRIC RANK
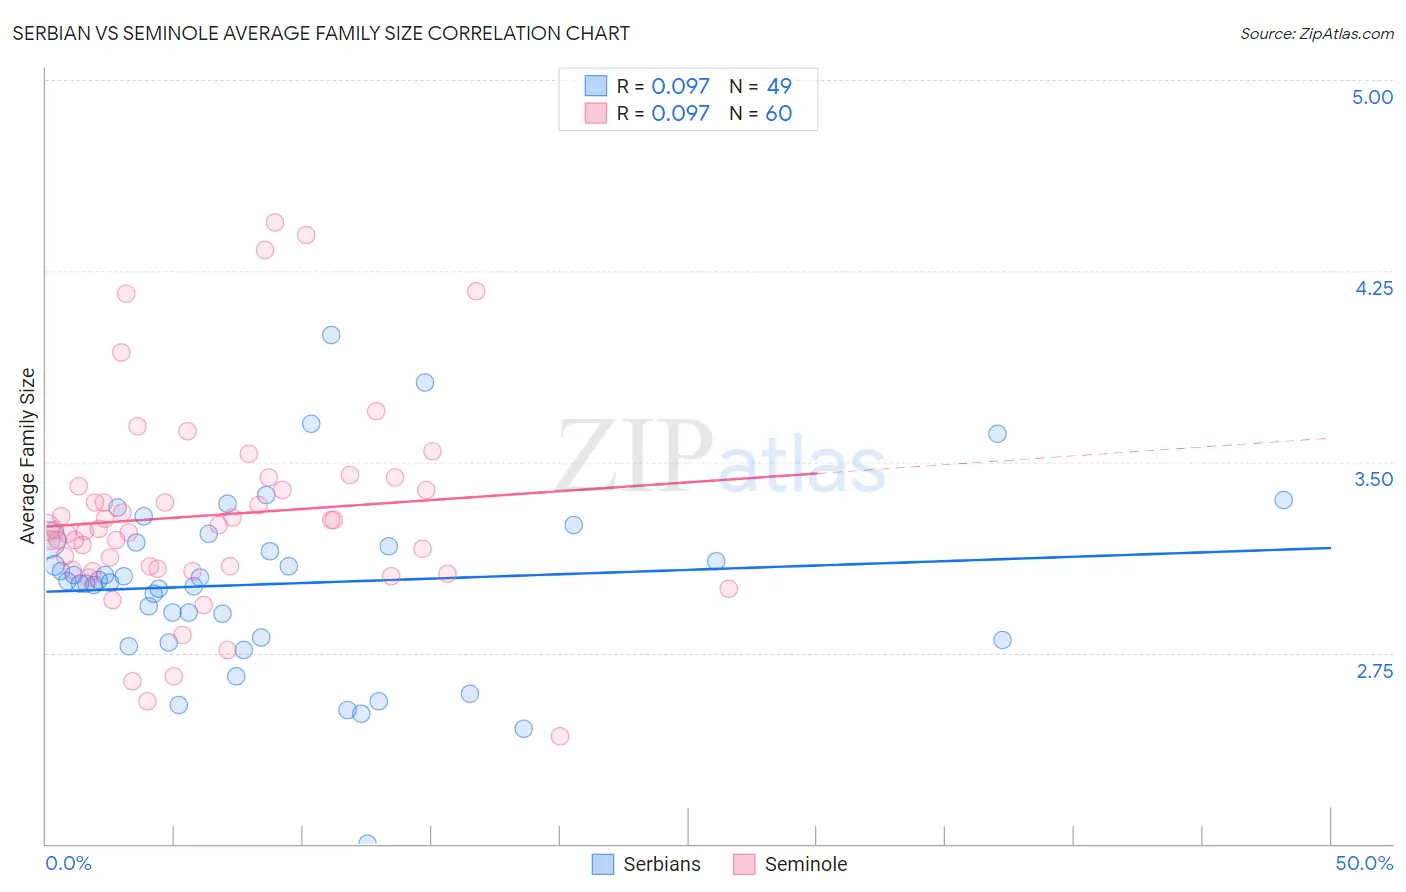
Serbian vs Seminole Average Family Size Correlation Chart
The statistical analysis conducted on geographies consisting of 267,532,826 people shows a slight positive correlation between the proportion of Serbians and average family size in the United States with a correlation coefficient (R) of 0.097 and weighted average of 3.12. Similarly, the statistical analysis conducted on geographies consisting of 118,298,481 people shows a slight positive correlation between the proportion of Seminole and average family size in the United States with a correlation coefficient (R) of 0.097 and weighted average of 3.24, a difference of 3.8%.
Average Family Size Correlation Summary
| Measurement | Serbian | Seminole |
| Minimum | 2.00 | 2.42 |
| Maximum | 4.00 | 4.44 |
| Range | 2.00 | 2.02 |
| Mean | 3.02 | 3.29 |
| Median | 3.03 | 3.24 |
| Interquartile 25% (IQ1) | 2.81 | 3.08 |
| Interquartile 75% (IQ3) | 3.19 | 3.40 |
| Interquartile Range (IQR) | 0.38 | 0.32 |
| Standard Deviation (Sample) | 0.35 | 0.41 |
| Standard Deviation (Population) | 0.35 | 0.40 |
Similar Demographics by Average Family Size
Demographics Similar to Serbians by Average Family Size
In terms of average family size, the demographic groups most similar to Serbians are Italian (3.12, a difference of 0.060%), Eastern European (3.12, a difference of 0.070%), Welsh (3.12, a difference of 0.070%), Immigrants from Scotland (3.12, a difference of 0.090%), and Russian (3.12, a difference of 0.11%).
| Demographics | Rating | Rank | Average Family Size |
| Northern Europeans | 0.1 /100 | #309 | Tragic 3.13 |
| Czechoslovakians | 0.1 /100 | #310 | Tragic 3.13 |
| Immigrants | Northern Europe | 0.1 /100 | #311 | Tragic 3.13 |
| Immigrants | Australia | 0.1 /100 | #312 | Tragic 3.13 |
| Bulgarians | 0.1 /100 | #313 | Tragic 3.13 |
| Russians | 0.1 /100 | #314 | Tragic 3.12 |
| Immigrants | Scotland | 0.1 /100 | #315 | Tragic 3.12 |
| Serbians | 0.1 /100 | #316 | Tragic 3.12 |
| Italians | 0.1 /100 | #317 | Tragic 3.12 |
| Eastern Europeans | 0.1 /100 | #318 | Tragic 3.12 |
| Welsh | 0.1 /100 | #319 | Tragic 3.12 |
| Immigrants | North America | 0.0 /100 | #320 | Tragic 3.12 |
| Immigrants | Austria | 0.0 /100 | #321 | Tragic 3.12 |
| Immigrants | Canada | 0.0 /100 | #322 | Tragic 3.12 |
| Soviet Union | 0.0 /100 | #323 | Tragic 3.11 |
Demographics Similar to Seminole by Average Family Size
In terms of average family size, the demographic groups most similar to Seminole are Immigrants from Taiwan (3.24, a difference of 0.0%), Immigrants from Uzbekistan (3.24, a difference of 0.020%), Immigrants from Egypt (3.24, a difference of 0.040%), Immigrants from Eritrea (3.24, a difference of 0.070%), and Iraqi (3.24, a difference of 0.080%).
| Demographics | Rating | Rank | Average Family Size |
| Blackfeet | 75.0 /100 | #148 | Good 3.24 |
| Assyrians/Chaldeans/Syriacs | 73.8 /100 | #149 | Good 3.24 |
| Indians (Asian) | 73.6 /100 | #150 | Good 3.24 |
| Jordanians | 73.5 /100 | #151 | Good 3.24 |
| Spanish Americans | 72.5 /100 | #152 | Good 3.24 |
| Immigrants | Eritrea | 71.4 /100 | #153 | Good 3.24 |
| Immigrants | Egypt | 70.0 /100 | #154 | Good 3.24 |
| Seminole | 68.2 /100 | #155 | Good 3.24 |
| Immigrants | Taiwan | 68.1 /100 | #156 | Good 3.24 |
| Immigrants | Uzbekistan | 67.0 /100 | #157 | Good 3.24 |
| Iraqis | 64.3 /100 | #158 | Good 3.24 |
| Ethiopians | 63.9 /100 | #159 | Good 3.24 |
| Immigrants | Iraq | 63.7 /100 | #160 | Good 3.24 |
| Immigrants | Chile | 63.2 /100 | #161 | Good 3.24 |
| Immigrants | Uganda | 60.1 /100 | #162 | Good 3.23 |