Serbian vs South American Indian Single Father Households
COMPARE
Serbian
South American Indian
Single Father Households
Single Father Households Comparison
Serbians
South American Indians
2.2%
SINGLE FATHER HOUSEHOLDS
96.8/ 100
METRIC RATING
129th/ 347
METRIC RANK
2.3%
SINGLE FATHER HOUSEHOLDS
88.5/ 100
METRIC RATING
148th/ 347
METRIC RANK
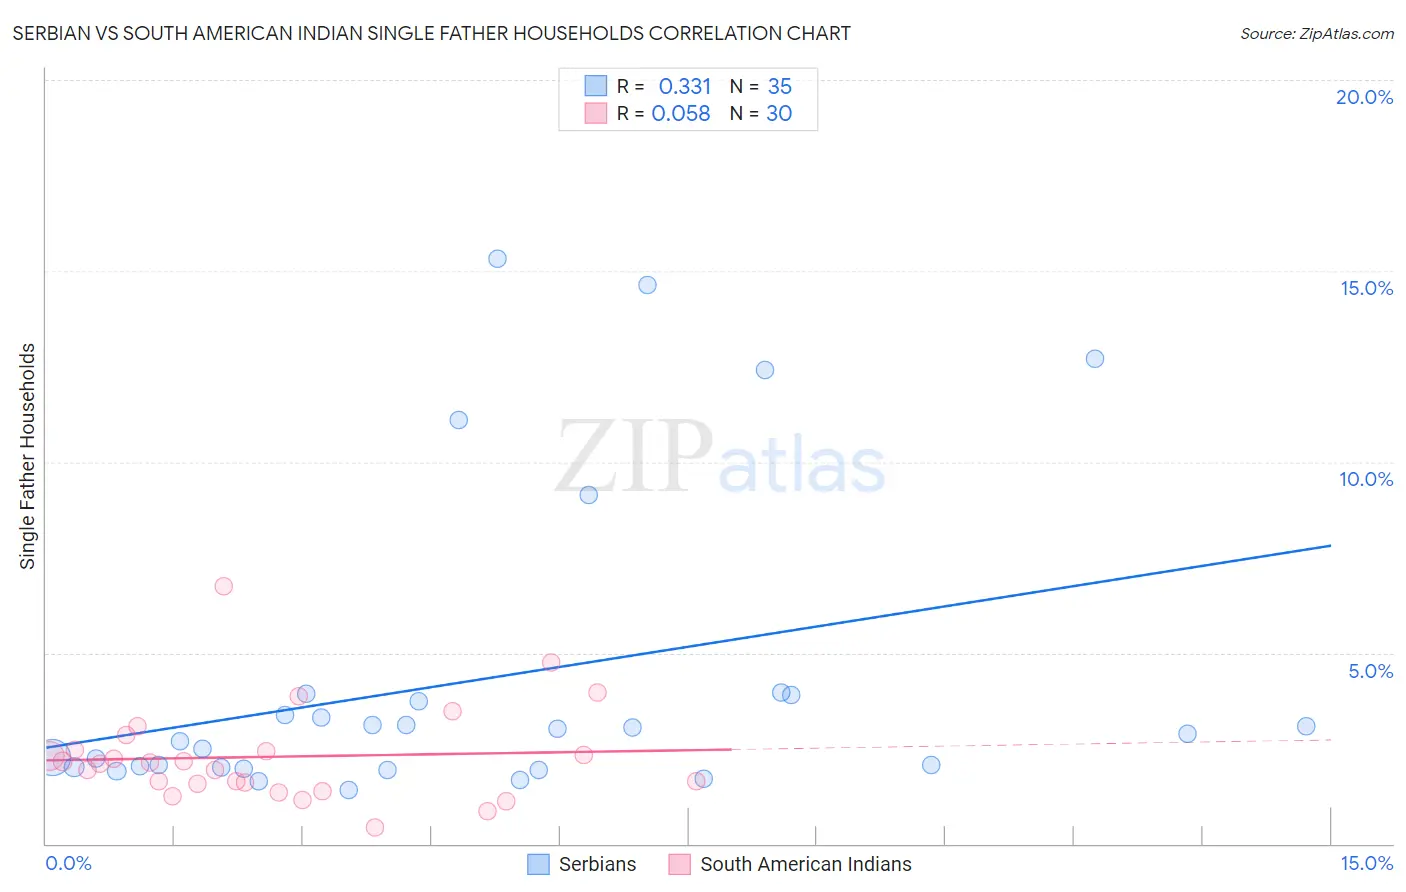
Serbian vs South American Indian Single Father Households Correlation Chart
The statistical analysis conducted on geographies consisting of 265,770,289 people shows a mild positive correlation between the proportion of Serbians and percentage of single father households in the United States with a correlation coefficient (R) of 0.331 and weighted average of 2.2%. Similarly, the statistical analysis conducted on geographies consisting of 164,166,551 people shows a slight positive correlation between the proportion of South American Indians and percentage of single father households in the United States with a correlation coefficient (R) of 0.058 and weighted average of 2.3%, a difference of 2.7%.
Single Father Households Correlation Summary
| Measurement | Serbian | South American Indian |
| Minimum | 1.4% | 0.43% |
| Maximum | 15.3% | 6.7% |
| Range | 13.9% | 6.3% |
| Mean | 4.3% | 2.3% |
| Median | 2.9% | 2.1% |
| Interquartile 25% (IQ1) | 2.0% | 1.6% |
| Interquartile 75% (IQ3) | 3.9% | 2.5% |
| Interquartile Range (IQR) | 1.9% | 0.87% |
| Standard Deviation (Sample) | 4.0% | 1.3% |
| Standard Deviation (Population) | 3.9% | 1.3% |
Demographics Similar to Serbians and South American Indians by Single Father Households
In terms of single father households, the demographic groups most similar to Serbians are Immigrants from England (2.2%, a difference of 0.010%), Immigrants from Chile (2.2%, a difference of 0.11%), Immigrants from Jordan (2.2%, a difference of 0.17%), Polish (2.2%, a difference of 0.19%), and Taiwanese (2.2%, a difference of 0.30%). Similarly, the demographic groups most similar to South American Indians are Slavic (2.2%, a difference of 0.090%), Northern European (2.2%, a difference of 0.27%), Immigrants from Zimbabwe (2.2%, a difference of 0.35%), Slovak (2.2%, a difference of 0.46%), and Immigrants from Nepal (2.2%, a difference of 0.80%).
| Demographics | Rating | Rank | Single Father Households |
| Immigrants | England | 96.8 /100 | #128 | Exceptional 2.2% |
| Serbians | 96.8 /100 | #129 | Exceptional 2.2% |
| Immigrants | Chile | 96.7 /100 | #130 | Exceptional 2.2% |
| Immigrants | Jordan | 96.6 /100 | #131 | Exceptional 2.2% |
| Poles | 96.5 /100 | #132 | Exceptional 2.2% |
| Taiwanese | 96.3 /100 | #133 | Exceptional 2.2% |
| Zimbabweans | 95.1 /100 | #134 | Exceptional 2.2% |
| Syrians | 94.8 /100 | #135 | Exceptional 2.2% |
| Chileans | 94.5 /100 | #136 | Exceptional 2.2% |
| Austrians | 94.2 /100 | #137 | Exceptional 2.2% |
| West Indians | 94.1 /100 | #138 | Exceptional 2.2% |
| Brazilians | 92.8 /100 | #139 | Exceptional 2.2% |
| British | 92.8 /100 | #140 | Exceptional 2.2% |
| Laotians | 92.5 /100 | #141 | Exceptional 2.2% |
| Luxembourgers | 92.3 /100 | #142 | Exceptional 2.2% |
| Immigrants | Nepal | 92.1 /100 | #143 | Exceptional 2.2% |
| Slovaks | 90.7 /100 | #144 | Exceptional 2.2% |
| Immigrants | Zimbabwe | 90.2 /100 | #145 | Exceptional 2.2% |
| Northern Europeans | 89.8 /100 | #146 | Excellent 2.2% |
| Slavs | 88.9 /100 | #147 | Excellent 2.2% |
| South American Indians | 88.5 /100 | #148 | Excellent 2.3% |