Serbian vs Yaqui Average Family Size
COMPARE
Serbian
Yaqui
Average Family Size
Average Family Size Comparison
Serbians
Yaqui
3.12
AVERAGE FAMILY SIZE
0.1/ 100
METRIC RATING
316th/ 347
METRIC RANK
3.32
AVERAGE FAMILY SIZE
99.9/ 100
METRIC RATING
73rd/ 347
METRIC RANK
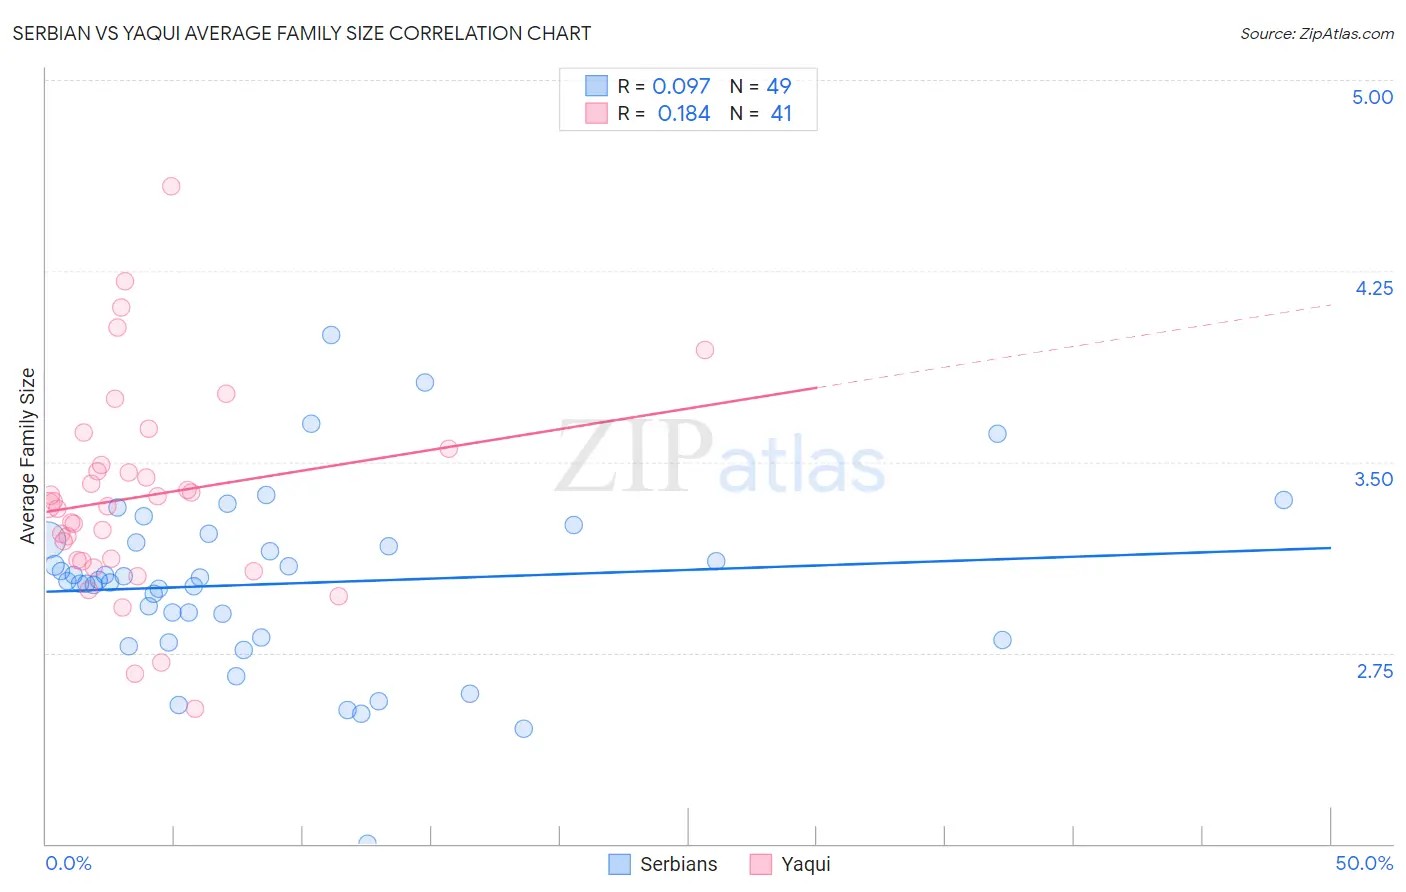
Serbian vs Yaqui Average Family Size Correlation Chart
The statistical analysis conducted on geographies consisting of 267,532,826 people shows a slight positive correlation between the proportion of Serbians and average family size in the United States with a correlation coefficient (R) of 0.097 and weighted average of 3.12. Similarly, the statistical analysis conducted on geographies consisting of 107,720,236 people shows a poor positive correlation between the proportion of Yaqui and average family size in the United States with a correlation coefficient (R) of 0.184 and weighted average of 3.32, a difference of 6.5%.
Average Family Size Correlation Summary
| Measurement | Serbian | Yaqui |
| Minimum | 2.00 | 2.53 |
| Maximum | 4.00 | 4.58 |
| Range | 2.00 | 2.05 |
| Mean | 3.02 | 3.37 |
| Median | 3.03 | 3.33 |
| Interquartile 25% (IQ1) | 2.81 | 3.11 |
| Interquartile 75% (IQ3) | 3.19 | 3.52 |
| Interquartile Range (IQR) | 0.38 | 0.41 |
| Standard Deviation (Sample) | 0.35 | 0.41 |
| Standard Deviation (Population) | 0.35 | 0.40 |
Similar Demographics by Average Family Size
Demographics Similar to Serbians by Average Family Size
In terms of average family size, the demographic groups most similar to Serbians are Italian (3.12, a difference of 0.060%), Eastern European (3.12, a difference of 0.070%), Welsh (3.12, a difference of 0.070%), Immigrants from Scotland (3.12, a difference of 0.090%), and Russian (3.12, a difference of 0.11%).
| Demographics | Rating | Rank | Average Family Size |
| Northern Europeans | 0.1 /100 | #309 | Tragic 3.13 |
| Czechoslovakians | 0.1 /100 | #310 | Tragic 3.13 |
| Immigrants | Northern Europe | 0.1 /100 | #311 | Tragic 3.13 |
| Immigrants | Australia | 0.1 /100 | #312 | Tragic 3.13 |
| Bulgarians | 0.1 /100 | #313 | Tragic 3.13 |
| Russians | 0.1 /100 | #314 | Tragic 3.12 |
| Immigrants | Scotland | 0.1 /100 | #315 | Tragic 3.12 |
| Serbians | 0.1 /100 | #316 | Tragic 3.12 |
| Italians | 0.1 /100 | #317 | Tragic 3.12 |
| Eastern Europeans | 0.1 /100 | #318 | Tragic 3.12 |
| Welsh | 0.1 /100 | #319 | Tragic 3.12 |
| Immigrants | North America | 0.0 /100 | #320 | Tragic 3.12 |
| Immigrants | Austria | 0.0 /100 | #321 | Tragic 3.12 |
| Immigrants | Canada | 0.0 /100 | #322 | Tragic 3.12 |
| Soviet Union | 0.0 /100 | #323 | Tragic 3.11 |
Demographics Similar to Yaqui by Average Family Size
In terms of average family size, the demographic groups most similar to Yaqui are Immigrants from Caribbean (3.33, a difference of 0.030%), Immigrants from Sierra Leone (3.32, a difference of 0.030%), Immigrants from Barbados (3.32, a difference of 0.060%), Trinidadian and Tobagonian (3.32, a difference of 0.080%), and Immigrants from Ecuador (3.32, a difference of 0.090%).
| Demographics | Rating | Rank | Average Family Size |
| Immigrants | St. Vincent and the Grenadines | 99.9 /100 | #66 | Exceptional 3.34 |
| Immigrants | Jamaica | 99.9 /100 | #67 | Exceptional 3.33 |
| Immigrants | Cambodia | 99.9 /100 | #68 | Exceptional 3.33 |
| Immigrants | Immigrants | 99.9 /100 | #69 | Exceptional 3.33 |
| Immigrants | Trinidad and Tobago | 99.9 /100 | #70 | Exceptional 3.33 |
| Immigrants | West Indies | 99.9 /100 | #71 | Exceptional 3.33 |
| Immigrants | Caribbean | 99.9 /100 | #72 | Exceptional 3.33 |
| Yaqui | 99.9 /100 | #73 | Exceptional 3.32 |
| Immigrants | Sierra Leone | 99.9 /100 | #74 | Exceptional 3.32 |
| Immigrants | Barbados | 99.8 /100 | #75 | Exceptional 3.32 |
| Trinidadians and Tobagonians | 99.8 /100 | #76 | Exceptional 3.32 |
| Immigrants | Ecuador | 99.8 /100 | #77 | Exceptional 3.32 |
| Immigrants | Micronesia | 99.8 /100 | #78 | Exceptional 3.32 |
| British West Indians | 99.8 /100 | #79 | Exceptional 3.32 |
| Lumbee | 99.8 /100 | #80 | Exceptional 3.32 |