Serbian vs Sierra Leonean Average Family Size
COMPARE
Serbian
Sierra Leonean
Average Family Size
Average Family Size Comparison
Serbians
Sierra Leoneans
3.12
AVERAGE FAMILY SIZE
0.1/ 100
METRIC RATING
316th/ 347
METRIC RANK
3.30
AVERAGE FAMILY SIZE
99.0/ 100
METRIC RATING
94th/ 347
METRIC RANK
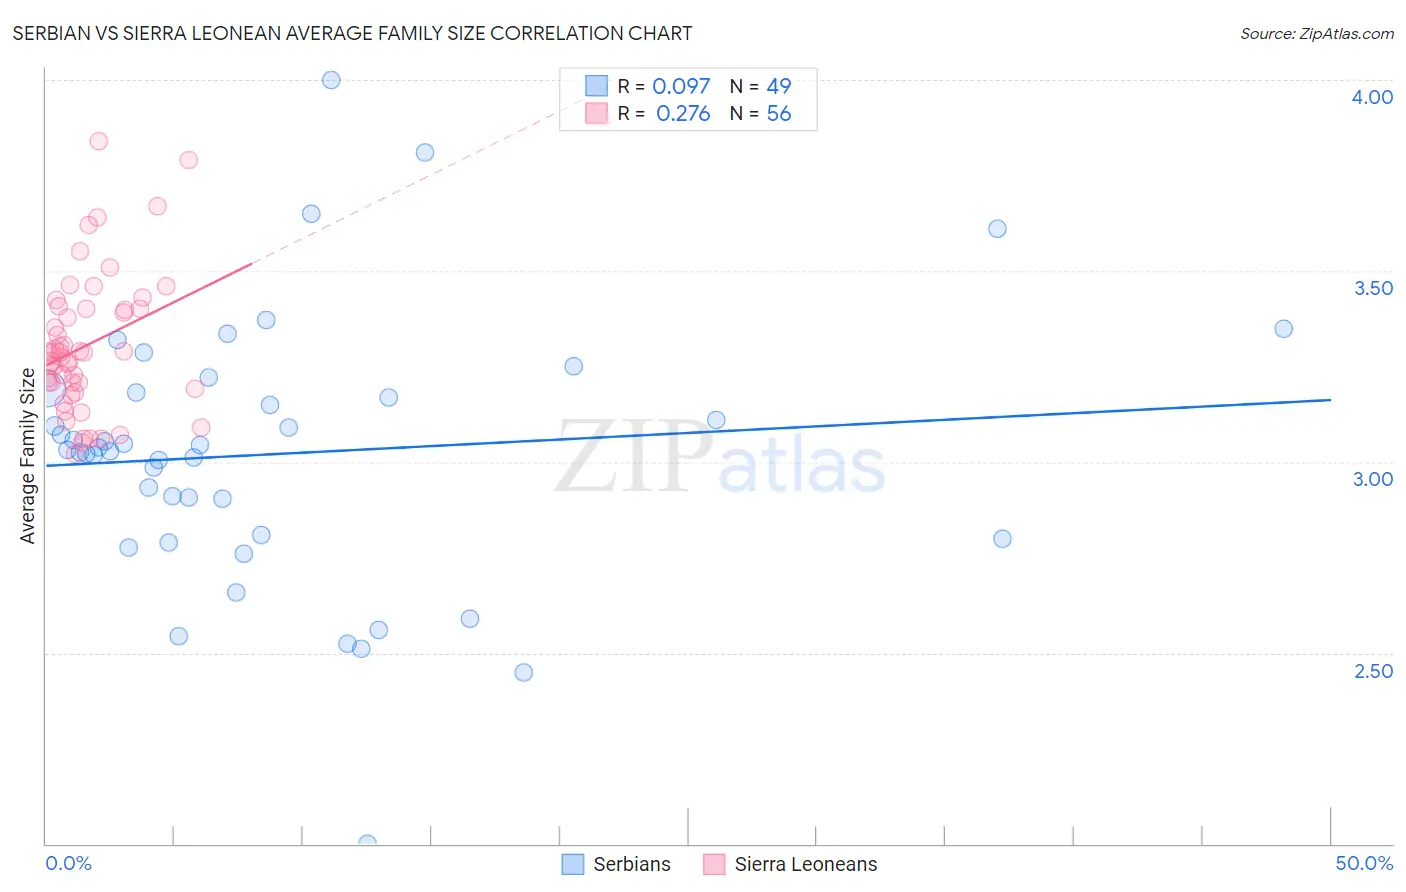
Serbian vs Sierra Leonean Average Family Size Correlation Chart
The statistical analysis conducted on geographies consisting of 267,532,826 people shows a slight positive correlation between the proportion of Serbians and average family size in the United States with a correlation coefficient (R) of 0.097 and weighted average of 3.12. Similarly, the statistical analysis conducted on geographies consisting of 83,343,424 people shows a weak positive correlation between the proportion of Sierra Leoneans and average family size in the United States with a correlation coefficient (R) of 0.276 and weighted average of 3.30, a difference of 5.6%.
Average Family Size Correlation Summary
| Measurement | Serbian | Sierra Leonean |
| Minimum | 2.00 | 3.02 |
| Maximum | 4.00 | 3.84 |
| Range | 2.00 | 0.82 |
| Mean | 3.02 | 3.31 |
| Median | 3.03 | 3.28 |
| Interquartile 25% (IQ1) | 2.81 | 3.20 |
| Interquartile 75% (IQ3) | 3.19 | 3.40 |
| Interquartile Range (IQR) | 0.38 | 0.20 |
| Standard Deviation (Sample) | 0.35 | 0.18 |
| Standard Deviation (Population) | 0.35 | 0.18 |
Similar Demographics by Average Family Size
Demographics Similar to Serbians by Average Family Size
In terms of average family size, the demographic groups most similar to Serbians are Italian (3.12, a difference of 0.060%), Eastern European (3.12, a difference of 0.070%), Welsh (3.12, a difference of 0.070%), Immigrants from Scotland (3.12, a difference of 0.090%), and Russian (3.12, a difference of 0.11%).
| Demographics | Rating | Rank | Average Family Size |
| Northern Europeans | 0.1 /100 | #309 | Tragic 3.13 |
| Czechoslovakians | 0.1 /100 | #310 | Tragic 3.13 |
| Immigrants | Northern Europe | 0.1 /100 | #311 | Tragic 3.13 |
| Immigrants | Australia | 0.1 /100 | #312 | Tragic 3.13 |
| Bulgarians | 0.1 /100 | #313 | Tragic 3.13 |
| Russians | 0.1 /100 | #314 | Tragic 3.12 |
| Immigrants | Scotland | 0.1 /100 | #315 | Tragic 3.12 |
| Serbians | 0.1 /100 | #316 | Tragic 3.12 |
| Italians | 0.1 /100 | #317 | Tragic 3.12 |
| Eastern Europeans | 0.1 /100 | #318 | Tragic 3.12 |
| Welsh | 0.1 /100 | #319 | Tragic 3.12 |
| Immigrants | North America | 0.0 /100 | #320 | Tragic 3.12 |
| Immigrants | Austria | 0.0 /100 | #321 | Tragic 3.12 |
| Immigrants | Canada | 0.0 /100 | #322 | Tragic 3.12 |
| Soviet Union | 0.0 /100 | #323 | Tragic 3.11 |
Demographics Similar to Sierra Leoneans by Average Family Size
In terms of average family size, the demographic groups most similar to Sierra Leoneans are Immigrants from Lebanon (3.30, a difference of 0.010%), U.S. Virgin Islander (3.29, a difference of 0.090%), Peruvian (3.30, a difference of 0.10%), Immigrants from Cameroon (3.30, a difference of 0.11%), and Immigrants from Pakistan (3.30, a difference of 0.12%).
| Demographics | Rating | Rank | Average Family Size |
| Immigrants | Peru | 99.7 /100 | #87 | Exceptional 3.31 |
| Immigrants | Bolivia | 99.6 /100 | #88 | Exceptional 3.31 |
| Malaysians | 99.6 /100 | #89 | Exceptional 3.31 |
| Menominee | 99.4 /100 | #90 | Exceptional 3.30 |
| Immigrants | Pakistan | 99.2 /100 | #91 | Exceptional 3.30 |
| Immigrants | Cameroon | 99.2 /100 | #92 | Exceptional 3.30 |
| Peruvians | 99.2 /100 | #93 | Exceptional 3.30 |
| Sierra Leoneans | 99.0 /100 | #94 | Exceptional 3.30 |
| Immigrants | Lebanon | 99.0 /100 | #95 | Exceptional 3.30 |
| U.S. Virgin Islanders | 98.8 /100 | #96 | Exceptional 3.29 |
| Immigrants | Oceania | 98.7 /100 | #97 | Exceptional 3.29 |
| Barbadians | 98.6 /100 | #98 | Exceptional 3.29 |
| Nigerians | 98.6 /100 | #99 | Exceptional 3.29 |
| Guamanians/Chamorros | 98.6 /100 | #100 | Exceptional 3.29 |
| Immigrants | Burma/Myanmar | 98.6 /100 | #101 | Exceptional 3.29 |