Serbian vs Immigrants from Denmark Cognitive Disability
COMPARE
Serbian
Immigrants from Denmark
Cognitive Disability
Cognitive Disability Comparison
Serbians
Immigrants from Denmark
16.7%
COGNITIVE DISABILITY
99.1/ 100
METRIC RATING
83rd/ 347
METRIC RANK
16.9%
COGNITIVE DISABILITY
96.2/ 100
METRIC RATING
118th/ 347
METRIC RANK
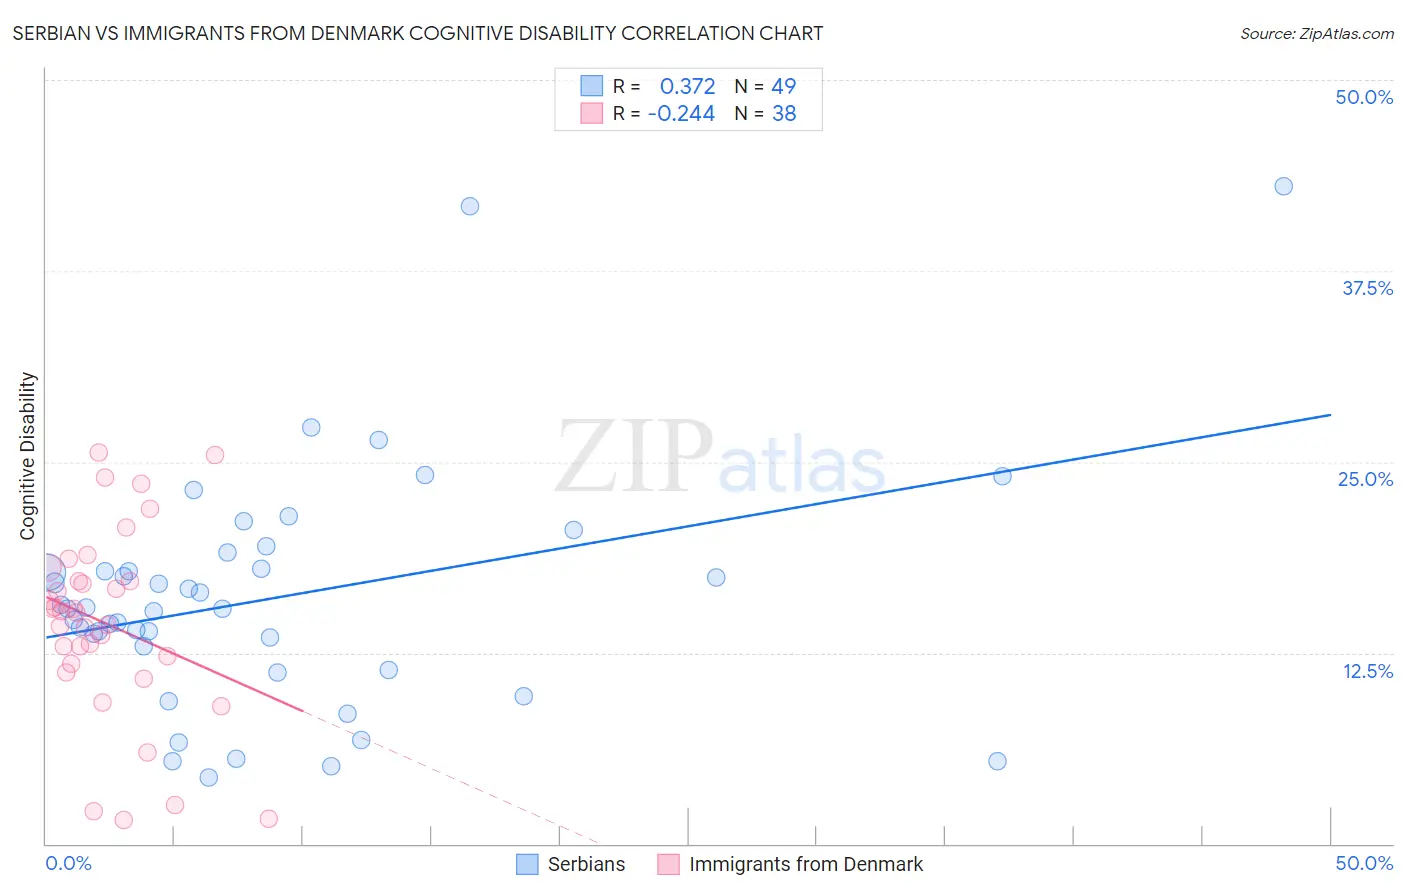
Serbian vs Immigrants from Denmark Cognitive Disability Correlation Chart
The statistical analysis conducted on geographies consisting of 267,644,527 people shows a mild positive correlation between the proportion of Serbians and percentage of population with cognitive disability in the United States with a correlation coefficient (R) of 0.372 and weighted average of 16.7%. Similarly, the statistical analysis conducted on geographies consisting of 136,432,525 people shows a weak negative correlation between the proportion of Immigrants from Denmark and percentage of population with cognitive disability in the United States with a correlation coefficient (R) of -0.244 and weighted average of 16.9%, a difference of 1.1%.
Cognitive Disability Correlation Summary
| Measurement | Serbian | Immigrants from Denmark |
| Minimum | 4.3% | 1.6% |
| Maximum | 43.1% | 25.6% |
| Range | 38.7% | 24.1% |
| Mean | 16.1% | 14.4% |
| Median | 15.4% | 15.2% |
| Interquartile 25% (IQ1) | 12.1% | 11.8% |
| Interquartile 75% (IQ3) | 18.6% | 17.2% |
| Interquartile Range (IQR) | 6.4% | 5.4% |
| Standard Deviation (Sample) | 7.8% | 6.1% |
| Standard Deviation (Population) | 7.7% | 6.1% |
Similar Demographics by Cognitive Disability
Demographics Similar to Serbians by Cognitive Disability
In terms of cognitive disability, the demographic groups most similar to Serbians are Belgian (16.7%, a difference of 0.020%), Immigrants from Moldova (16.7%, a difference of 0.030%), Swiss (16.7%, a difference of 0.070%), Immigrants from South Africa (16.7%, a difference of 0.070%), and Native Hawaiian (16.7%, a difference of 0.080%).
| Demographics | Rating | Rank | Cognitive Disability |
| Immigrants | Serbia | 99.3 /100 | #76 | Exceptional 16.7% |
| Immigrants | Hungary | 99.3 /100 | #77 | Exceptional 16.7% |
| Peruvians | 99.3 /100 | #78 | Exceptional 16.7% |
| Immigrants | Bulgaria | 99.3 /100 | #79 | Exceptional 16.7% |
| Egyptians | 99.2 /100 | #80 | Exceptional 16.7% |
| Immigrants | Netherlands | 99.2 /100 | #81 | Exceptional 16.7% |
| Swiss | 99.2 /100 | #82 | Exceptional 16.7% |
| Serbians | 99.1 /100 | #83 | Exceptional 16.7% |
| Belgians | 99.1 /100 | #84 | Exceptional 16.7% |
| Immigrants | Moldova | 99.1 /100 | #85 | Exceptional 16.7% |
| Immigrants | South Africa | 99.0 /100 | #86 | Exceptional 16.7% |
| Native Hawaiians | 99.0 /100 | #87 | Exceptional 16.7% |
| Immigrants | Philippines | 99.0 /100 | #88 | Exceptional 16.7% |
| Immigrants | Egypt | 98.8 /100 | #89 | Exceptional 16.7% |
| South Americans | 98.8 /100 | #90 | Exceptional 16.7% |
Demographics Similar to Immigrants from Denmark by Cognitive Disability
In terms of cognitive disability, the demographic groups most similar to Immigrants from Denmark are Immigrants from Japan (16.9%, a difference of 0.010%), Inupiat (16.9%, a difference of 0.060%), South African (16.9%, a difference of 0.13%), Yup'ik (16.9%, a difference of 0.16%), and Immigrants from Sri Lanka (16.8%, a difference of 0.21%).
| Demographics | Rating | Rank | Cognitive Disability |
| Uruguayans | 97.2 /100 | #111 | Exceptional 16.8% |
| Indians (Asian) | 97.2 /100 | #112 | Exceptional 16.8% |
| Immigrants | Sri Lanka | 97.1 /100 | #113 | Exceptional 16.8% |
| Koreans | 97.1 /100 | #114 | Exceptional 16.8% |
| Yup'ik | 96.9 /100 | #115 | Exceptional 16.9% |
| Inupiat | 96.5 /100 | #116 | Exceptional 16.9% |
| Immigrants | Japan | 96.2 /100 | #117 | Exceptional 16.9% |
| Immigrants | Denmark | 96.2 /100 | #118 | Exceptional 16.9% |
| South Africans | 95.5 /100 | #119 | Exceptional 16.9% |
| Scottish | 95.0 /100 | #120 | Exceptional 16.9% |
| Immigrants | China | 94.9 /100 | #121 | Exceptional 16.9% |
| Immigrants | Western Europe | 94.8 /100 | #122 | Exceptional 16.9% |
| Portuguese | 94.7 /100 | #123 | Exceptional 16.9% |
| Turks | 94.5 /100 | #124 | Exceptional 16.9% |
| Scandinavians | 94.1 /100 | #125 | Exceptional 16.9% |