Moroccan vs Burmese Married-couple Households
COMPARE
Moroccan
Burmese
Married-couple Households
Married-couple Households Comparison
Moroccans
Burmese
43.5%
MARRIED-COUPLE HOUSEHOLDS
0.1/ 100
METRIC RATING
265th/ 347
METRIC RANK
49.8%
MARRIED-COUPLE HOUSEHOLDS
100.0/ 100
METRIC RATING
14th/ 347
METRIC RANK
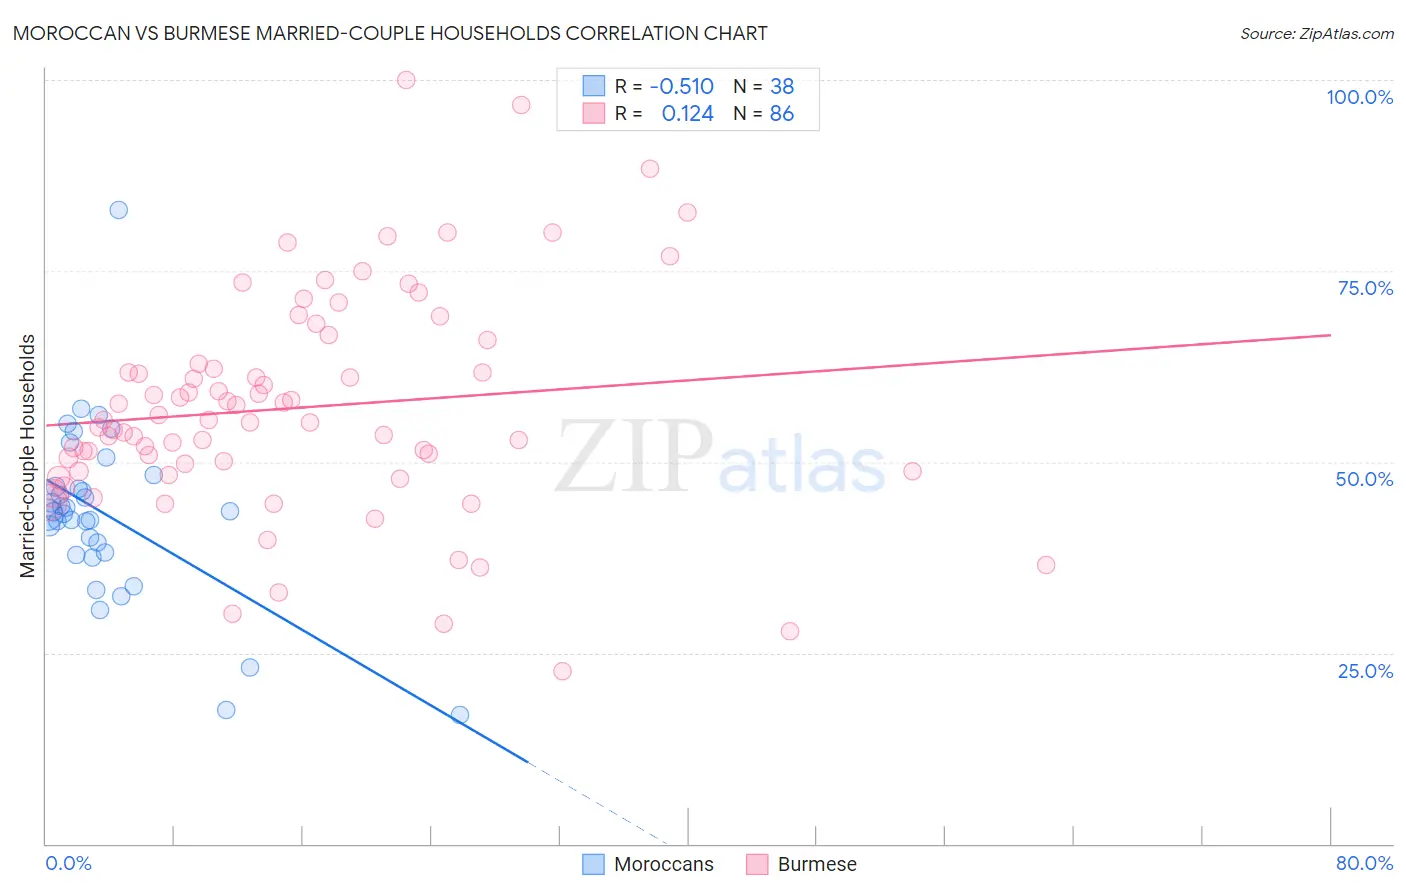
Moroccan vs Burmese Married-couple Households Correlation Chart
The statistical analysis conducted on geographies consisting of 201,755,880 people shows a substantial negative correlation between the proportion of Moroccans and percentage of married-couple family households in the United States with a correlation coefficient (R) of -0.510 and weighted average of 43.5%. Similarly, the statistical analysis conducted on geographies consisting of 464,866,079 people shows a poor positive correlation between the proportion of Burmese and percentage of married-couple family households in the United States with a correlation coefficient (R) of 0.124 and weighted average of 49.8%, a difference of 14.5%.
Married-couple Households Correlation Summary
| Measurement | Moroccan | Burmese |
| Minimum | 16.8% | 22.5% |
| Maximum | 83.0% | 100.0% |
| Range | 66.2% | 77.5% |
| Mean | 43.1% | 57.1% |
| Median | 43.3% | 55.3% |
| Interquartile 25% (IQ1) | 38.2% | 48.7% |
| Interquartile 75% (IQ3) | 46.7% | 62.8% |
| Interquartile Range (IQR) | 8.5% | 14.0% |
| Standard Deviation (Sample) | 11.5% | 14.5% |
| Standard Deviation (Population) | 11.3% | 14.4% |
Similar Demographics by Married-couple Households
Demographics Similar to Moroccans by Married-couple Households
In terms of married-couple households, the demographic groups most similar to Moroccans are Ecuadorian (43.5%, a difference of 0.040%), Bangladeshi (43.5%, a difference of 0.080%), Native/Alaskan (43.5%, a difference of 0.090%), Cree (43.6%, a difference of 0.19%), and Immigrants from Burma/Myanmar (43.4%, a difference of 0.20%).
| Demographics | Rating | Rank | Married-couple Households |
| Central American Indians | 0.2 /100 | #258 | Tragic 43.8% |
| Iroquois | 0.2 /100 | #259 | Tragic 43.7% |
| Immigrants | Cameroon | 0.2 /100 | #260 | Tragic 43.7% |
| Alaskan Athabascans | 0.2 /100 | #261 | Tragic 43.6% |
| Vietnamese | 0.2 /100 | #262 | Tragic 43.6% |
| Cree | 0.1 /100 | #263 | Tragic 43.6% |
| Bangladeshis | 0.1 /100 | #264 | Tragic 43.5% |
| Moroccans | 0.1 /100 | #265 | Tragic 43.5% |
| Ecuadorians | 0.1 /100 | #266 | Tragic 43.5% |
| Natives/Alaskans | 0.1 /100 | #267 | Tragic 43.5% |
| Immigrants | Burma/Myanmar | 0.1 /100 | #268 | Tragic 43.4% |
| Immigrants | Sierra Leone | 0.1 /100 | #269 | Tragic 43.3% |
| Yuman | 0.1 /100 | #270 | Tragic 43.3% |
| Guatemalans | 0.1 /100 | #271 | Tragic 43.3% |
| Immigrants | Nigeria | 0.1 /100 | #272 | Tragic 43.2% |
Demographics Similar to Burmese by Married-couple Households
In terms of married-couple households, the demographic groups most similar to Burmese are Immigrants from Korea (49.9%, a difference of 0.13%), Korean (49.7%, a difference of 0.14%), Swedish (49.7%, a difference of 0.18%), Swiss (49.9%, a difference of 0.30%), and Immigrants from Hong Kong (49.6%, a difference of 0.33%).
| Demographics | Rating | Rank | Married-couple Households |
| Filipinos | 100.0 /100 | #7 | Exceptional 51.0% |
| Immigrants | South Central Asia | 100.0 /100 | #8 | Exceptional 50.6% |
| Pennsylvania Germans | 100.0 /100 | #9 | Exceptional 50.4% |
| Chinese | 100.0 /100 | #10 | Exceptional 50.4% |
| Immigrants | Pakistan | 100.0 /100 | #11 | Exceptional 50.1% |
| Swiss | 100.0 /100 | #12 | Exceptional 49.9% |
| Immigrants | Korea | 100.0 /100 | #13 | Exceptional 49.9% |
| Burmese | 100.0 /100 | #14 | Exceptional 49.8% |
| Koreans | 99.9 /100 | #15 | Exceptional 49.7% |
| Swedes | 99.9 /100 | #16 | Exceptional 49.7% |
| Immigrants | Hong Kong | 99.9 /100 | #17 | Exceptional 49.6% |
| English | 99.9 /100 | #18 | Exceptional 49.6% |
| Europeans | 99.9 /100 | #19 | Exceptional 49.6% |
| Scandinavians | 99.9 /100 | #20 | Exceptional 49.6% |
| Norwegians | 99.9 /100 | #21 | Exceptional 49.5% |