Immigrants from Belize vs Nonimmigrants Average Family Size
COMPARE
Immigrants from Belize
Nonimmigrants
Average Family Size
Average Family Size Comparison
Immigrants from Belize
Nonimmigrants
3.39
AVERAGE FAMILY SIZE
100.0/ 100
METRIC RATING
38th/ 347
METRIC RANK
3.19
AVERAGE FAMILY SIZE
5.7/ 100
METRIC RATING
228th/ 347
METRIC RANK
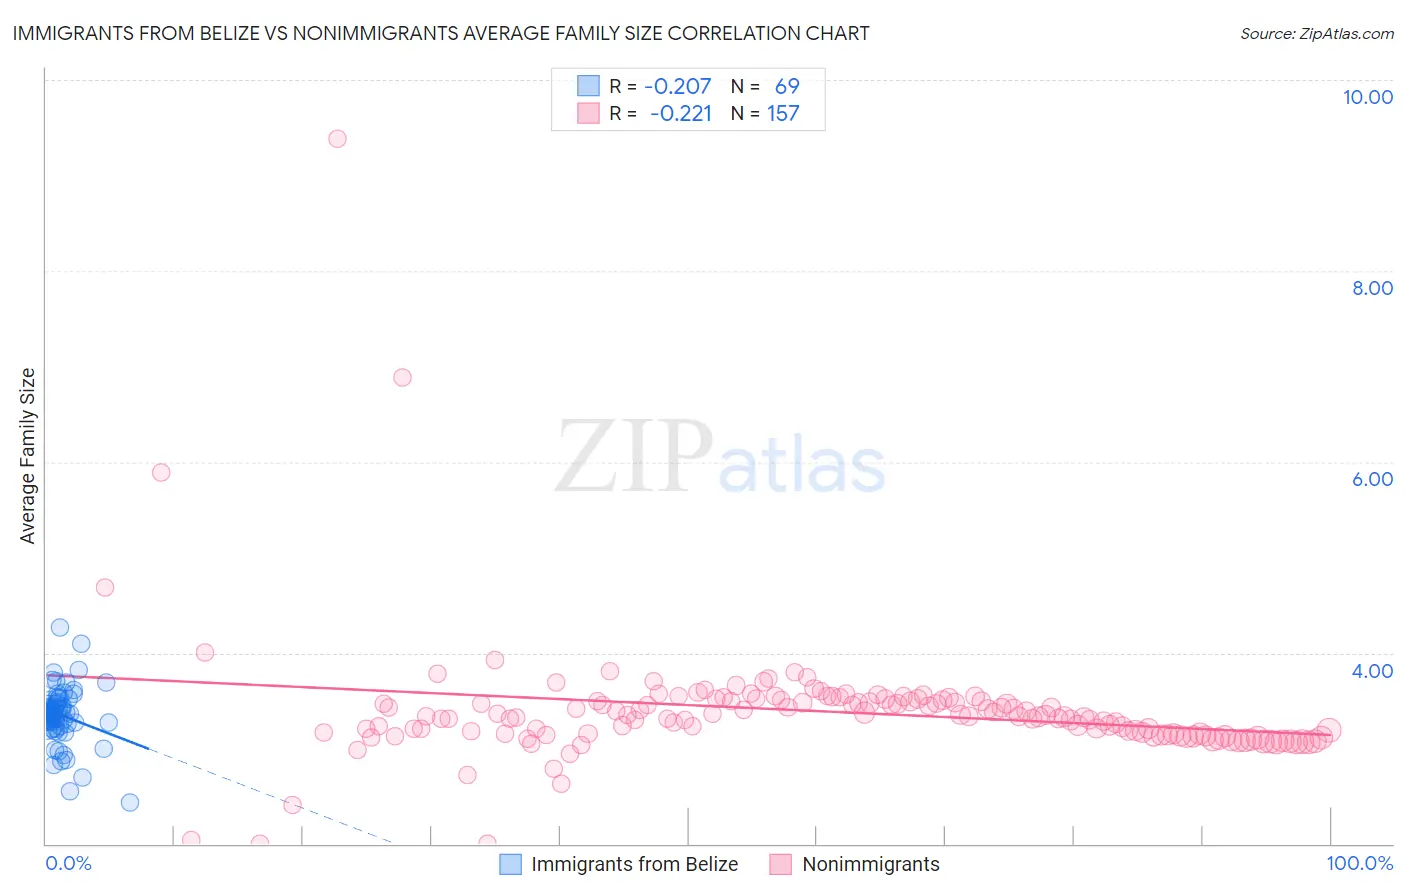
Immigrants from Belize vs Nonimmigrants Average Family Size Correlation Chart
The statistical analysis conducted on geographies consisting of 130,207,410 people shows a weak negative correlation between the proportion of Immigrants from Belize and average family size in the United States with a correlation coefficient (R) of -0.207 and weighted average of 3.39. Similarly, the statistical analysis conducted on geographies consisting of 584,651,869 people shows a weak negative correlation between the proportion of Nonimmigrants and average family size in the United States with a correlation coefficient (R) of -0.221 and weighted average of 3.19, a difference of 6.5%.
Average Family Size Correlation Summary
| Measurement | Immigrants from Belize | Nonimmigrants |
| Minimum | 2.43 | 2.00 |
| Maximum | 4.26 | 9.38 |
| Range | 1.83 | 7.38 |
| Mean | 3.35 | 3.39 |
| Median | 3.37 | 3.33 |
| Interquartile 25% (IQ1) | 3.26 | 3.14 |
| Interquartile 75% (IQ3) | 3.49 | 3.50 |
| Interquartile Range (IQR) | 0.23 | 0.36 |
| Standard Deviation (Sample) | 0.30 | 0.67 |
| Standard Deviation (Population) | 0.30 | 0.67 |
Similar Demographics by Average Family Size
Demographics Similar to Immigrants from Belize by Average Family Size
In terms of average family size, the demographic groups most similar to Immigrants from Belize are Immigrants from Haiti (3.39, a difference of 0.080%), Guyanese (3.40, a difference of 0.16%), Belizean (3.39, a difference of 0.20%), Immigrants from Guyana (3.40, a difference of 0.30%), and Guatemalan (3.40, a difference of 0.35%).
| Demographics | Rating | Rank | Average Family Size |
| Central Americans | 100.0 /100 | #31 | Exceptional 3.41 |
| Immigrants | Guatemala | 100.0 /100 | #32 | Exceptional 3.41 |
| Hawaiians | 100.0 /100 | #33 | Exceptional 3.41 |
| Hispanics or Latinos | 100.0 /100 | #34 | Exceptional 3.41 |
| Guatemalans | 100.0 /100 | #35 | Exceptional 3.40 |
| Immigrants | Guyana | 100.0 /100 | #36 | Exceptional 3.40 |
| Guyanese | 100.0 /100 | #37 | Exceptional 3.40 |
| Immigrants | Belize | 100.0 /100 | #38 | Exceptional 3.39 |
| Immigrants | Haiti | 100.0 /100 | #39 | Exceptional 3.39 |
| Belizeans | 100.0 /100 | #40 | Exceptional 3.39 |
| Marshallese | 100.0 /100 | #41 | Exceptional 3.38 |
| Immigrants | Vietnam | 100.0 /100 | #42 | Exceptional 3.38 |
| Immigrants | Philippines | 100.0 /100 | #43 | Exceptional 3.37 |
| Alaska Natives | 100.0 /100 | #44 | Exceptional 3.37 |
| Shoshone | 100.0 /100 | #45 | Exceptional 3.37 |
Demographics Similar to Nonimmigrants by Average Family Size
In terms of average family size, the demographic groups most similar to Nonimmigrants are Portuguese (3.19, a difference of 0.020%), Chickasaw (3.19, a difference of 0.030%), Cree (3.19, a difference of 0.040%), Immigrants from Italy (3.19, a difference of 0.040%), and Icelander (3.19, a difference of 0.050%).
| Demographics | Rating | Rank | Average Family Size |
| Immigrants | Ukraine | 7.2 /100 | #221 | Tragic 3.19 |
| Immigrants | Kuwait | 7.2 /100 | #222 | Tragic 3.19 |
| Immigrants | Zimbabwe | 7.1 /100 | #223 | Tragic 3.19 |
| Syrians | 6.5 /100 | #224 | Tragic 3.19 |
| Cree | 6.2 /100 | #225 | Tragic 3.19 |
| Chickasaw | 6.0 /100 | #226 | Tragic 3.19 |
| Portuguese | 6.0 /100 | #227 | Tragic 3.19 |
| Immigrants | Nonimmigrants | 5.7 /100 | #228 | Tragic 3.19 |
| Immigrants | Italy | 5.3 /100 | #229 | Tragic 3.19 |
| Icelanders | 5.2 /100 | #230 | Tragic 3.19 |
| Basques | 5.2 /100 | #231 | Tragic 3.19 |
| Cherokee | 4.7 /100 | #232 | Tragic 3.18 |
| Brazilians | 4.5 /100 | #233 | Tragic 3.18 |
| Iranians | 4.5 /100 | #234 | Tragic 3.18 |
| Immigrants | Turkey | 4.2 /100 | #235 | Tragic 3.18 |