Northern European vs Nonimmigrants Average Family Size
COMPARE
Northern European
Nonimmigrants
Average Family Size
Average Family Size Comparison
Northern Europeans
Nonimmigrants
3.13
AVERAGE FAMILY SIZE
0.1/ 100
METRIC RATING
309th/ 347
METRIC RANK
3.19
AVERAGE FAMILY SIZE
5.7/ 100
METRIC RATING
228th/ 347
METRIC RANK
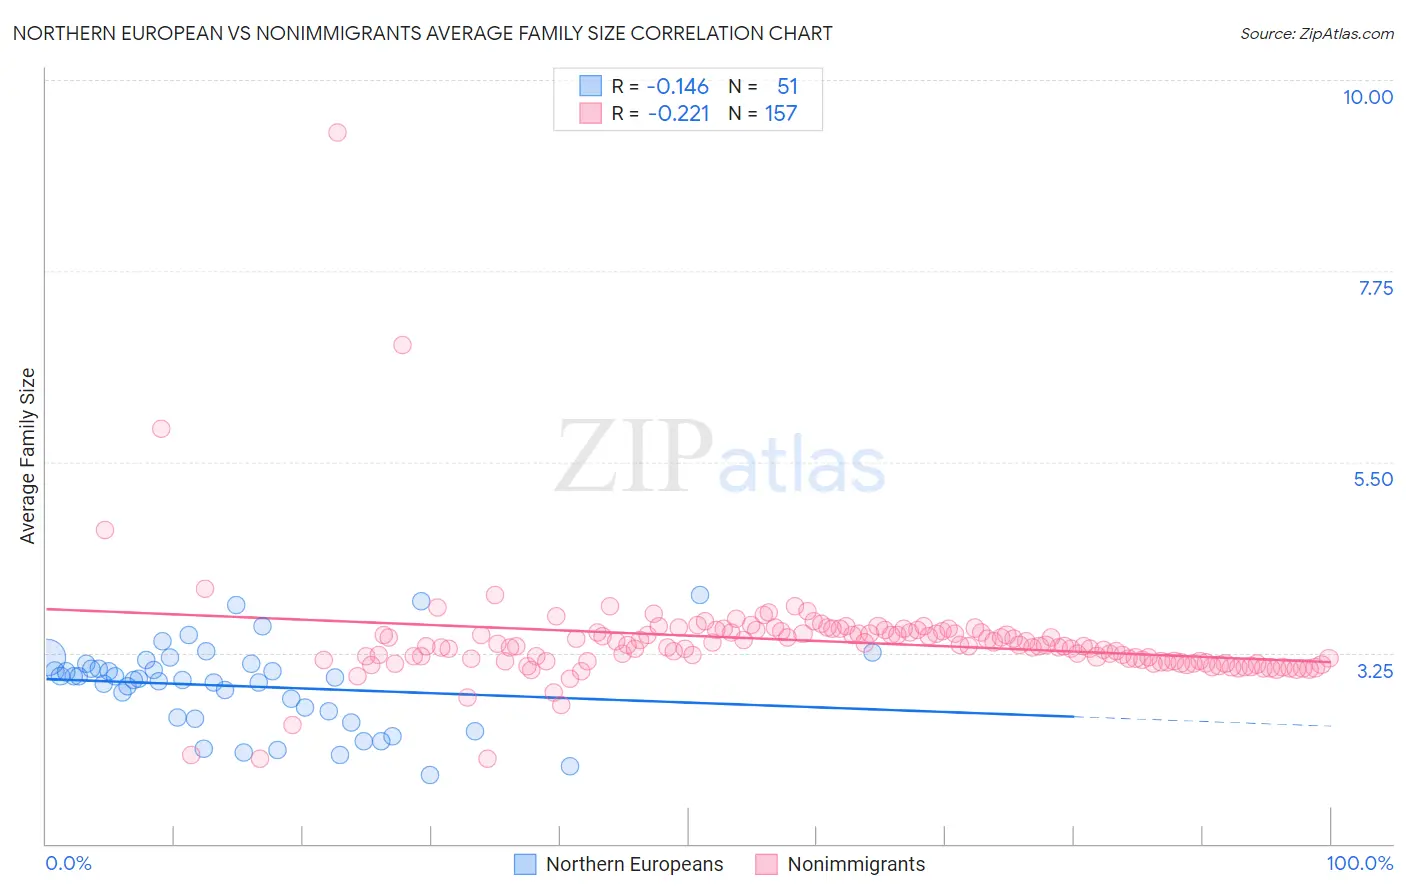
Northern European vs Nonimmigrants Average Family Size Correlation Chart
The statistical analysis conducted on geographies consisting of 405,947,196 people shows a poor negative correlation between the proportion of Northern Europeans and average family size in the United States with a correlation coefficient (R) of -0.146 and weighted average of 3.13. Similarly, the statistical analysis conducted on geographies consisting of 584,651,869 people shows a weak negative correlation between the proportion of Nonimmigrants and average family size in the United States with a correlation coefficient (R) of -0.221 and weighted average of 3.19, a difference of 1.9%.
Average Family Size Correlation Summary
| Measurement | Northern European | Nonimmigrants |
| Minimum | 1.81 | 2.00 |
| Maximum | 3.93 | 9.38 |
| Range | 2.12 | 7.38 |
| Mean | 2.86 | 3.39 |
| Median | 2.95 | 3.33 |
| Interquartile 25% (IQ1) | 2.49 | 3.14 |
| Interquartile 75% (IQ3) | 3.12 | 3.50 |
| Interquartile Range (IQR) | 0.63 | 0.36 |
| Standard Deviation (Sample) | 0.49 | 0.67 |
| Standard Deviation (Population) | 0.48 | 0.67 |
Similar Demographics by Average Family Size
Demographics Similar to Northern Europeans by Average Family Size
In terms of average family size, the demographic groups most similar to Northern Europeans are Slavic (3.13, a difference of 0.010%), Czechoslovakian (3.13, a difference of 0.020%), Immigrants from Ireland (3.13, a difference of 0.060%), Immigrants from Serbia (3.13, a difference of 0.060%), and Immigrants from Northern Europe (3.13, a difference of 0.060%).
| Demographics | Rating | Rank | Average Family Size |
| Immigrants | Latvia | 0.2 /100 | #302 | Tragic 3.13 |
| British | 0.2 /100 | #303 | Tragic 3.13 |
| Immigrants | Switzerland | 0.2 /100 | #304 | Tragic 3.13 |
| Australians | 0.1 /100 | #305 | Tragic 3.13 |
| Immigrants | Ireland | 0.1 /100 | #306 | Tragic 3.13 |
| Immigrants | Serbia | 0.1 /100 | #307 | Tragic 3.13 |
| Slavs | 0.1 /100 | #308 | Tragic 3.13 |
| Northern Europeans | 0.1 /100 | #309 | Tragic 3.13 |
| Czechoslovakians | 0.1 /100 | #310 | Tragic 3.13 |
| Immigrants | Northern Europe | 0.1 /100 | #311 | Tragic 3.13 |
| Immigrants | Australia | 0.1 /100 | #312 | Tragic 3.13 |
| Bulgarians | 0.1 /100 | #313 | Tragic 3.13 |
| Russians | 0.1 /100 | #314 | Tragic 3.12 |
| Immigrants | Scotland | 0.1 /100 | #315 | Tragic 3.12 |
| Serbians | 0.1 /100 | #316 | Tragic 3.12 |
Demographics Similar to Nonimmigrants by Average Family Size
In terms of average family size, the demographic groups most similar to Nonimmigrants are Portuguese (3.19, a difference of 0.020%), Chickasaw (3.19, a difference of 0.030%), Cree (3.19, a difference of 0.040%), Immigrants from Italy (3.19, a difference of 0.040%), and Icelander (3.19, a difference of 0.050%).
| Demographics | Rating | Rank | Average Family Size |
| Immigrants | Ukraine | 7.2 /100 | #221 | Tragic 3.19 |
| Immigrants | Kuwait | 7.2 /100 | #222 | Tragic 3.19 |
| Immigrants | Zimbabwe | 7.1 /100 | #223 | Tragic 3.19 |
| Syrians | 6.5 /100 | #224 | Tragic 3.19 |
| Cree | 6.2 /100 | #225 | Tragic 3.19 |
| Chickasaw | 6.0 /100 | #226 | Tragic 3.19 |
| Portuguese | 6.0 /100 | #227 | Tragic 3.19 |
| Immigrants | Nonimmigrants | 5.7 /100 | #228 | Tragic 3.19 |
| Immigrants | Italy | 5.3 /100 | #229 | Tragic 3.19 |
| Icelanders | 5.2 /100 | #230 | Tragic 3.19 |
| Basques | 5.2 /100 | #231 | Tragic 3.19 |
| Cherokee | 4.7 /100 | #232 | Tragic 3.18 |
| Brazilians | 4.5 /100 | #233 | Tragic 3.18 |
| Iranians | 4.5 /100 | #234 | Tragic 3.18 |
| Immigrants | Turkey | 4.2 /100 | #235 | Tragic 3.18 |