Scotch-Irish vs Nonimmigrants Householder Income Ages 25 - 44 years
COMPARE
Scotch-Irish
Nonimmigrants
Householder Income Ages 25 - 44 years
Householder Income Ages 25 - 44 years Comparison
Scotch-Irish
Nonimmigrants
$89,969
HOUSEHOLDER INCOME AGES 25 - 44 YEARS
7.3/ 100
METRIC RATING
217th/ 347
METRIC RANK
$88,301
HOUSEHOLDER INCOME AGES 25 - 44 YEARS
3.0/ 100
METRIC RATING
232nd/ 347
METRIC RANK
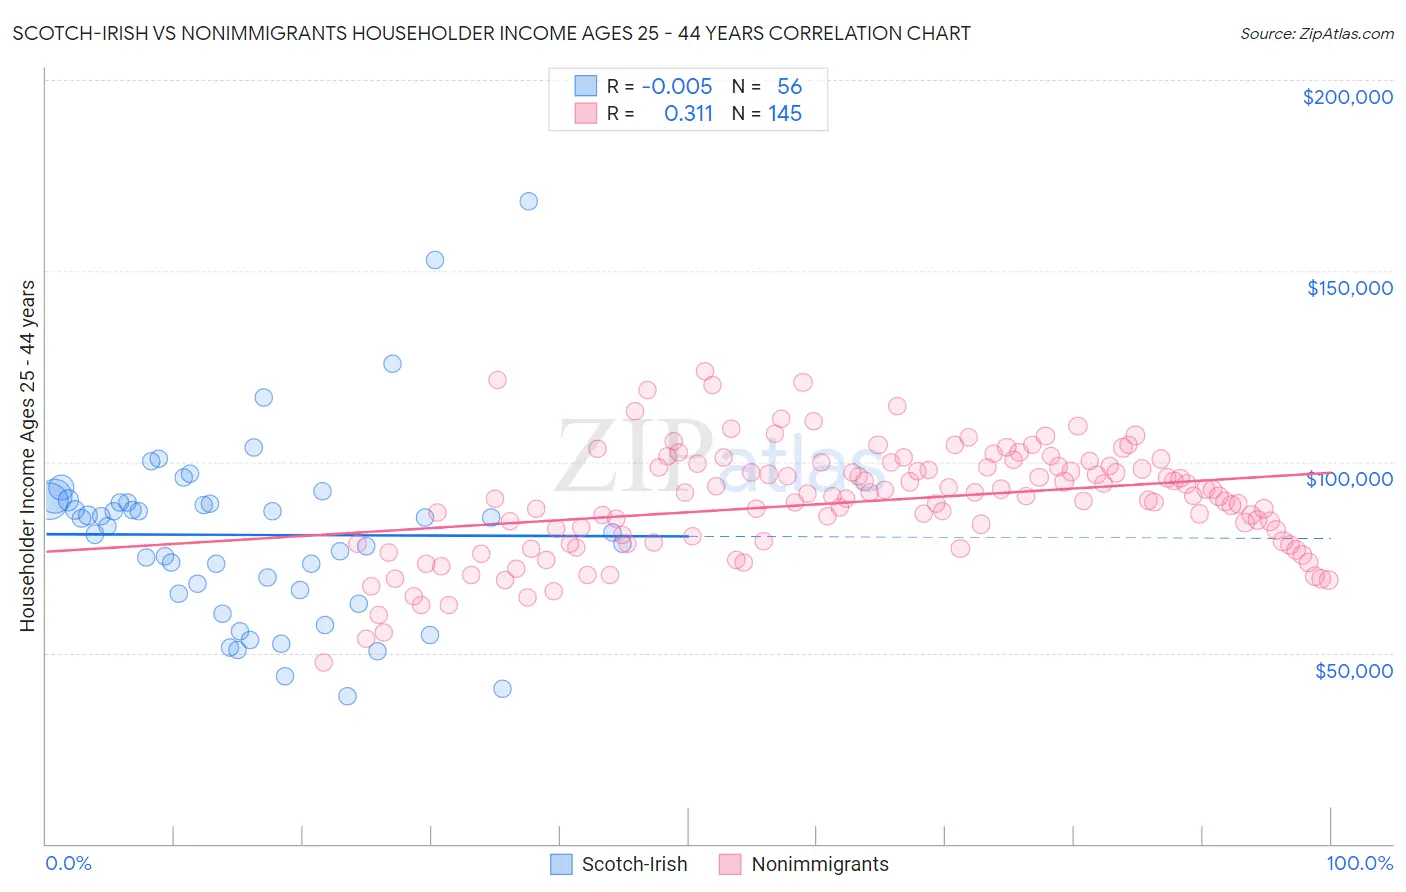
Scotch-Irish vs Nonimmigrants Householder Income Ages 25 - 44 years Correlation Chart
The statistical analysis conducted on geographies consisting of 544,063,779 people shows no correlation between the proportion of Scotch-Irish and household income with householder between the ages 25 and 44 in the United States with a correlation coefficient (R) of -0.005 and weighted average of $89,969. Similarly, the statistical analysis conducted on geographies consisting of 576,019,560 people shows a mild positive correlation between the proportion of Nonimmigrants and household income with householder between the ages 25 and 44 in the United States with a correlation coefficient (R) of 0.311 and weighted average of $88,301, a difference of 1.9%.
Householder Income Ages 25 - 44 years Correlation Summary
| Measurement | Scotch-Irish | Nonimmigrants |
| Minimum | $38,615 | $47,510 |
| Maximum | $168,086 | $123,721 |
| Range | $129,471 | $76,211 |
| Mean | $80,873 | $89,568 |
| Median | $84,225 | $91,026 |
| Interquartile 25% (IQ1) | $65,999 | $78,698 |
| Interquartile 75% (IQ3) | $89,511 | $99,239 |
| Interquartile Range (IQR) | $23,512 | $20,541 |
| Standard Deviation (Sample) | $23,988 | $14,473 |
| Standard Deviation (Population) | $23,773 | $14,423 |
Demographics Similar to Scotch-Irish and Nonimmigrants by Householder Income Ages 25 - 44 years
In terms of householder income ages 25 - 44 years, the demographic groups most similar to Scotch-Irish are Guyanese ($89,940, a difference of 0.030%), Delaware ($89,876, a difference of 0.10%), Trinidadian and Tobagonian ($89,856, a difference of 0.13%), Ghanaian ($90,137, a difference of 0.19%), and Panamanian ($90,193, a difference of 0.25%). Similarly, the demographic groups most similar to Nonimmigrants are Immigrants from Grenada ($88,311, a difference of 0.010%), Malaysian ($88,291, a difference of 0.010%), Venezuelan ($88,232, a difference of 0.080%), Alaskan Athabascan ($88,446, a difference of 0.16%), and Immigrants from Barbados ($88,687, a difference of 0.44%).
| Demographics | Rating | Rank | Householder Income Ages 25 - 44 years |
| Immigrants | Africa | 8.9 /100 | #214 | Tragic $90,372 |
| Panamanians | 8.1 /100 | #215 | Tragic $90,193 |
| Ghanaians | 7.9 /100 | #216 | Tragic $90,137 |
| Scotch-Irish | 7.3 /100 | #217 | Tragic $89,969 |
| Guyanese | 7.1 /100 | #218 | Tragic $89,940 |
| Delaware | 6.9 /100 | #219 | Tragic $89,876 |
| Trinidadians and Tobagonians | 6.8 /100 | #220 | Tragic $89,856 |
| Immigrants | Trinidad and Tobago | 6.5 /100 | #221 | Tragic $89,748 |
| Immigrants | Ecuador | 6.2 /100 | #222 | Tragic $89,673 |
| Immigrants | Guyana | 5.9 /100 | #223 | Tragic $89,586 |
| Barbadians | 5.9 /100 | #224 | Tragic $89,565 |
| Immigrants | Panama | 5.5 /100 | #225 | Tragic $89,451 |
| Immigrants | Iraq | 5.5 /100 | #226 | Tragic $89,444 |
| Immigrants | St. Vincent and the Grenadines | 4.1 /100 | #227 | Tragic $88,888 |
| Immigrants | Bosnia and Herzegovina | 4.0 /100 | #228 | Tragic $88,819 |
| Immigrants | Barbados | 3.7 /100 | #229 | Tragic $88,687 |
| Alaskan Athabascans | 3.3 /100 | #230 | Tragic $88,446 |
| Immigrants | Grenada | 3.0 /100 | #231 | Tragic $88,311 |
| Immigrants | Nonimmigrants | 3.0 /100 | #232 | Tragic $88,301 |
| Malaysians | 3.0 /100 | #233 | Tragic $88,291 |
| Venezuelans | 2.9 /100 | #234 | Tragic $88,232 |