Scandinavian vs Okinawan Single Father Poverty
COMPARE
Scandinavian
Okinawan
Single Father Poverty
Single Father Poverty Comparison
Scandinavians
Okinawans
16.3%
SINGLE FATHER POVERTY
52.3/ 100
METRIC RATING
170th/ 347
METRIC RANK
14.6%
SINGLE FATHER POVERTY
100.0/ 100
METRIC RATING
33rd/ 347
METRIC RANK
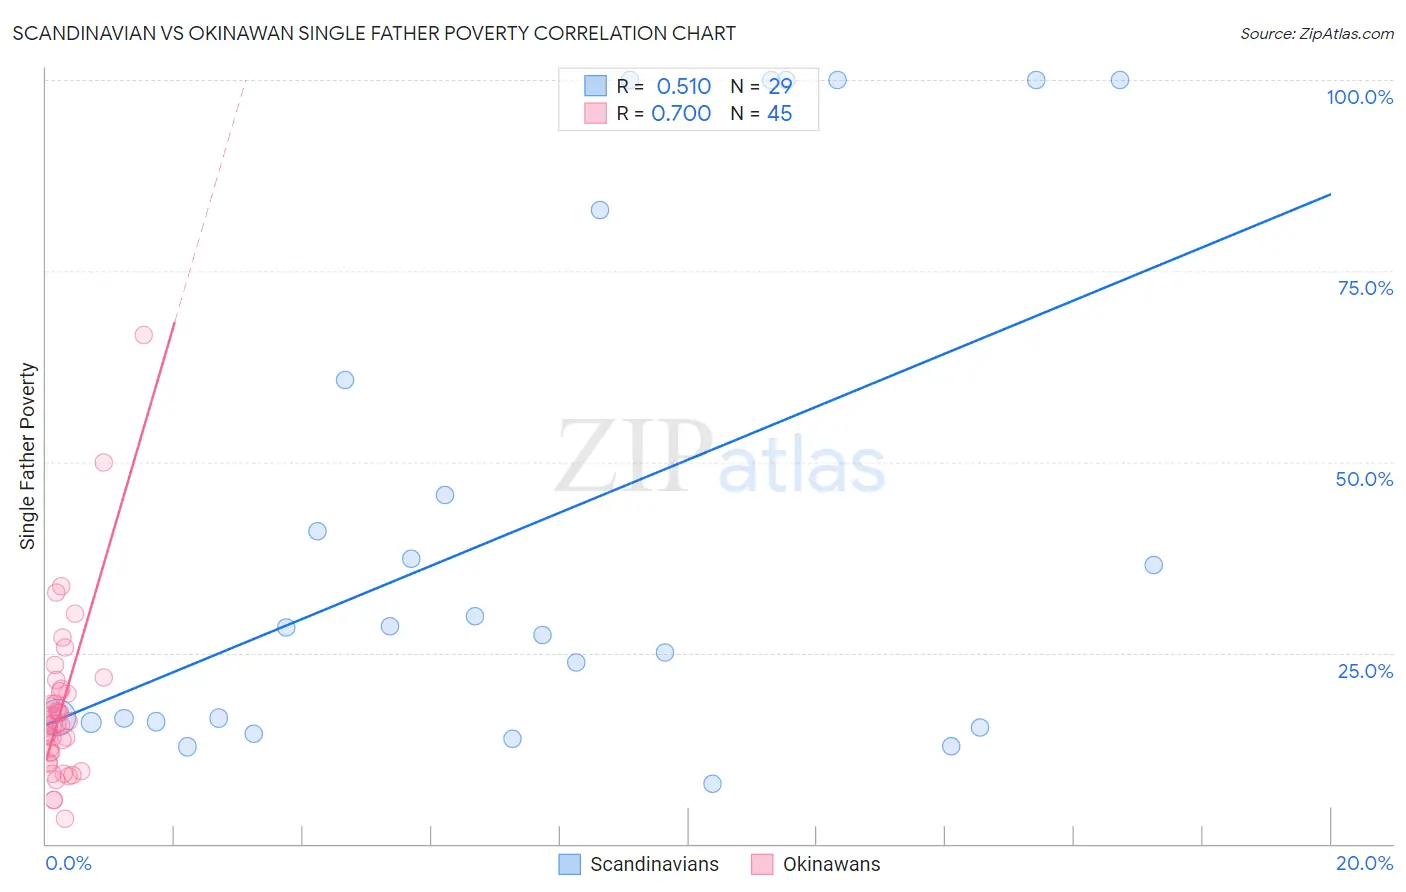
Scandinavian vs Okinawan Single Father Poverty Correlation Chart
The statistical analysis conducted on geographies consisting of 353,551,665 people shows a substantial positive correlation between the proportion of Scandinavians and poverty level among single fathers in the United States with a correlation coefficient (R) of 0.510 and weighted average of 16.3%. Similarly, the statistical analysis conducted on geographies consisting of 67,888,416 people shows a strong positive correlation between the proportion of Okinawans and poverty level among single fathers in the United States with a correlation coefficient (R) of 0.700 and weighted average of 14.6%, a difference of 11.2%.
Single Father Poverty Correlation Summary
| Measurement | Scandinavian | Okinawan |
| Minimum | 7.8% | 3.3% |
| Maximum | 100.0% | 66.7% |
| Range | 92.2% | 63.4% |
| Mean | 42.2% | 17.9% |
| Median | 28.3% | 15.8% |
| Interquartile 25% (IQ1) | 15.9% | 11.3% |
| Interquartile 75% (IQ3) | 71.8% | 20.1% |
| Interquartile Range (IQR) | 55.9% | 8.8% |
| Standard Deviation (Sample) | 33.9% | 11.2% |
| Standard Deviation (Population) | 33.3% | 11.1% |
Similar Demographics by Single Father Poverty
Demographics Similar to Scandinavians by Single Father Poverty
In terms of single father poverty, the demographic groups most similar to Scandinavians are Northern European (16.3%, a difference of 0.020%), Costa Rican (16.3%, a difference of 0.060%), Yugoslavian (16.3%, a difference of 0.070%), Immigrants from Morocco (16.3%, a difference of 0.070%), and Immigrants from Sierra Leone (16.3%, a difference of 0.10%).
| Demographics | Rating | Rank | Single Father Poverty |
| Immigrants | Costa Rica | 55.7 /100 | #163 | Average 16.3% |
| Guyanese | 55.2 /100 | #164 | Average 16.3% |
| Immigrants | Bangladesh | 55.1 /100 | #165 | Average 16.3% |
| Immigrants | Europe | 54.8 /100 | #166 | Average 16.3% |
| Yugoslavians | 53.9 /100 | #167 | Average 16.3% |
| Costa Ricans | 53.6 /100 | #168 | Average 16.3% |
| Northern Europeans | 52.8 /100 | #169 | Average 16.3% |
| Scandinavians | 52.3 /100 | #170 | Average 16.3% |
| Immigrants | Morocco | 50.7 /100 | #171 | Average 16.3% |
| Immigrants | Sierra Leone | 50.1 /100 | #172 | Average 16.3% |
| Immigrants | St. Vincent and the Grenadines | 50.0 /100 | #173 | Average 16.3% |
| Swedes | 50.0 /100 | #174 | Average 16.3% |
| Immigrants | Ecuador | 49.7 /100 | #175 | Average 16.3% |
| Vietnamese | 48.0 /100 | #176 | Average 16.3% |
| Immigrants | South Africa | 44.2 /100 | #177 | Average 16.3% |
Demographics Similar to Okinawans by Single Father Poverty
In terms of single father poverty, the demographic groups most similar to Okinawans are Egyptian (14.7%, a difference of 0.10%), Immigrants from Bolivia (14.7%, a difference of 0.17%), Immigrants from Indonesia (14.7%, a difference of 0.33%), Immigrants from Eastern Africa (14.7%, a difference of 0.46%), and Bolivian (14.7%, a difference of 0.47%).
| Demographics | Rating | Rank | Single Father Poverty |
| Spanish American Indians | 100.0 /100 | #26 | Exceptional 14.4% |
| Nepalese | 100.0 /100 | #27 | Exceptional 14.4% |
| Immigrants | South Central Asia | 100.0 /100 | #28 | Exceptional 14.5% |
| Somalis | 100.0 /100 | #29 | Exceptional 14.5% |
| Thais | 100.0 /100 | #30 | Exceptional 14.5% |
| Icelanders | 100.0 /100 | #31 | Exceptional 14.5% |
| Asians | 100.0 /100 | #32 | Exceptional 14.6% |
| Okinawans | 100.0 /100 | #33 | Exceptional 14.6% |
| Egyptians | 100.0 /100 | #34 | Exceptional 14.7% |
| Immigrants | Bolivia | 100.0 /100 | #35 | Exceptional 14.7% |
| Immigrants | Indonesia | 100.0 /100 | #36 | Exceptional 14.7% |
| Immigrants | Eastern Africa | 100.0 /100 | #37 | Exceptional 14.7% |
| Bolivians | 100.0 /100 | #38 | Exceptional 14.7% |
| Immigrants | Asia | 100.0 /100 | #39 | Exceptional 14.7% |
| Pima | 100.0 /100 | #40 | Exceptional 14.8% |