Houma vs Okinawan Average Family Size
COMPARE
Houma
Okinawan
Average Family Size
Average Family Size Comparison
Houma
Okinawans
3.18
AVERAGE FAMILY SIZE
3.4/ 100
METRIC RATING
239th/ 347
METRIC RANK
3.15
AVERAGE FAMILY SIZE
0.5/ 100
METRIC RATING
278th/ 347
METRIC RANK
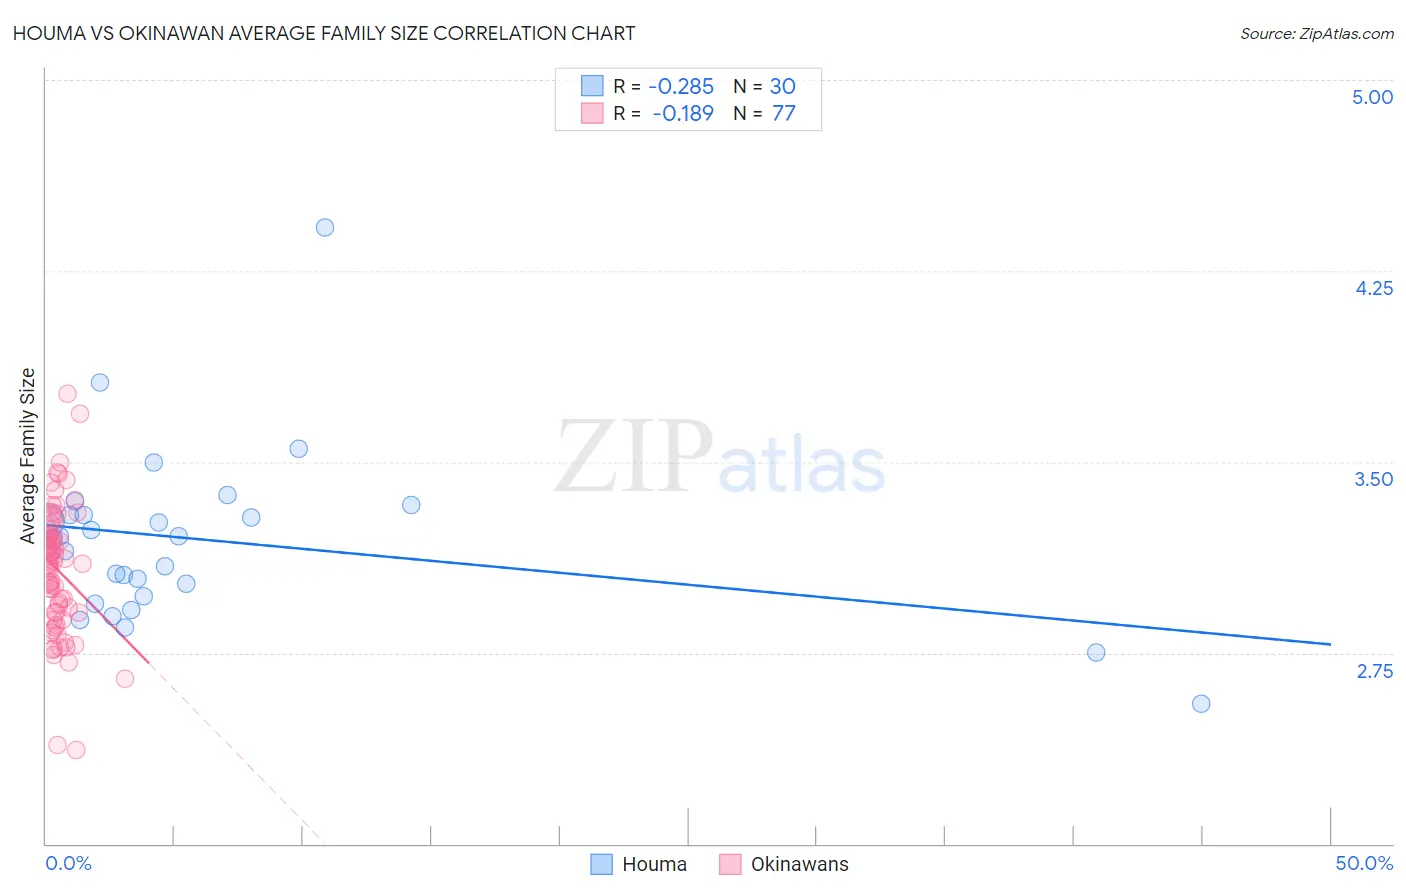
Houma vs Okinawan Average Family Size Correlation Chart
The statistical analysis conducted on geographies consisting of 36,793,313 people shows a weak negative correlation between the proportion of Houma and average family size in the United States with a correlation coefficient (R) of -0.285 and weighted average of 3.18. Similarly, the statistical analysis conducted on geographies consisting of 73,730,021 people shows a poor negative correlation between the proportion of Okinawans and average family size in the United States with a correlation coefficient (R) of -0.189 and weighted average of 3.15, a difference of 0.93%.
Average Family Size Correlation Summary
| Measurement | Houma | Okinawan |
| Minimum | 2.55 | 2.37 |
| Maximum | 4.42 | 3.77 |
| Range | 1.87 | 1.40 |
| Mean | 3.19 | 3.08 |
| Median | 3.20 | 3.10 |
| Interquartile 25% (IQ1) | 2.97 | 2.91 |
| Interquartile 75% (IQ3) | 3.29 | 3.21 |
| Interquartile Range (IQR) | 0.32 | 0.30 |
| Standard Deviation (Sample) | 0.34 | 0.25 |
| Standard Deviation (Population) | 0.34 | 0.25 |
Similar Demographics by Average Family Size
Demographics Similar to Houma by Average Family Size
In terms of average family size, the demographic groups most similar to Houma are Osage (3.18, a difference of 0.020%), Immigrants from Romania (3.18, a difference of 0.050%), Romanian (3.18, a difference of 0.050%), Immigrants from Japan (3.18, a difference of 0.050%), and Hungarian (3.18, a difference of 0.060%).
| Demographics | Rating | Rank | Average Family Size |
| Cherokee | 4.7 /100 | #232 | Tragic 3.18 |
| Brazilians | 4.5 /100 | #233 | Tragic 3.18 |
| Iranians | 4.5 /100 | #234 | Tragic 3.18 |
| Immigrants | Turkey | 4.2 /100 | #235 | Tragic 3.18 |
| Immigrants | Portugal | 4.2 /100 | #236 | Tragic 3.18 |
| Immigrants | Romania | 3.7 /100 | #237 | Tragic 3.18 |
| Romanians | 3.7 /100 | #238 | Tragic 3.18 |
| Houma | 3.4 /100 | #239 | Tragic 3.18 |
| Osage | 3.2 /100 | #240 | Tragic 3.18 |
| Immigrants | Japan | 3.0 /100 | #241 | Tragic 3.18 |
| Hungarians | 3.0 /100 | #242 | Tragic 3.18 |
| Immigrants | Moldova | 2.9 /100 | #243 | Tragic 3.18 |
| Immigrants | Southern Europe | 2.9 /100 | #244 | Tragic 3.18 |
| Immigrants | Brazil | 2.7 /100 | #245 | Tragic 3.18 |
| Danes | 2.5 /100 | #246 | Tragic 3.17 |
Demographics Similar to Okinawans by Average Family Size
In terms of average family size, the demographic groups most similar to Okinawans are Immigrants from Europe (3.15, a difference of 0.020%), Swiss (3.15, a difference of 0.030%), Immigrants from Bosnia and Herzegovina (3.15, a difference of 0.040%), Immigrants from England (3.15, a difference of 0.040%), and Immigrants from Denmark (3.15, a difference of 0.080%).
| Demographics | Rating | Rank | Average Family Size |
| Immigrants | Germany | 0.7 /100 | #271 | Tragic 3.15 |
| Immigrants | Lithuania | 0.6 /100 | #272 | Tragic 3.15 |
| New Zealanders | 0.6 /100 | #273 | Tragic 3.15 |
| Immigrants | Belgium | 0.6 /100 | #274 | Tragic 3.15 |
| Cambodians | 0.6 /100 | #275 | Tragic 3.15 |
| Immigrants | Bosnia and Herzegovina | 0.5 /100 | #276 | Tragic 3.15 |
| Swiss | 0.5 /100 | #277 | Tragic 3.15 |
| Okinawans | 0.5 /100 | #278 | Tragic 3.15 |
| Immigrants | Europe | 0.5 /100 | #279 | Tragic 3.15 |
| Immigrants | England | 0.4 /100 | #280 | Tragic 3.15 |
| Immigrants | Denmark | 0.4 /100 | #281 | Tragic 3.15 |
| Yugoslavians | 0.4 /100 | #282 | Tragic 3.15 |
| German Russians | 0.4 /100 | #283 | Tragic 3.15 |
| Immigrants | France | 0.4 /100 | #284 | Tragic 3.15 |
| Whites/Caucasians | 0.3 /100 | #285 | Tragic 3.14 |