Immigrants from Lithuania vs Okinawan Average Family Size
COMPARE
Immigrants from Lithuania
Okinawan
Average Family Size
Average Family Size Comparison
Immigrants from Lithuania
Okinawans
3.15
AVERAGE FAMILY SIZE
0.6/ 100
METRIC RATING
272nd/ 347
METRIC RANK
3.15
AVERAGE FAMILY SIZE
0.5/ 100
METRIC RATING
278th/ 347
METRIC RANK
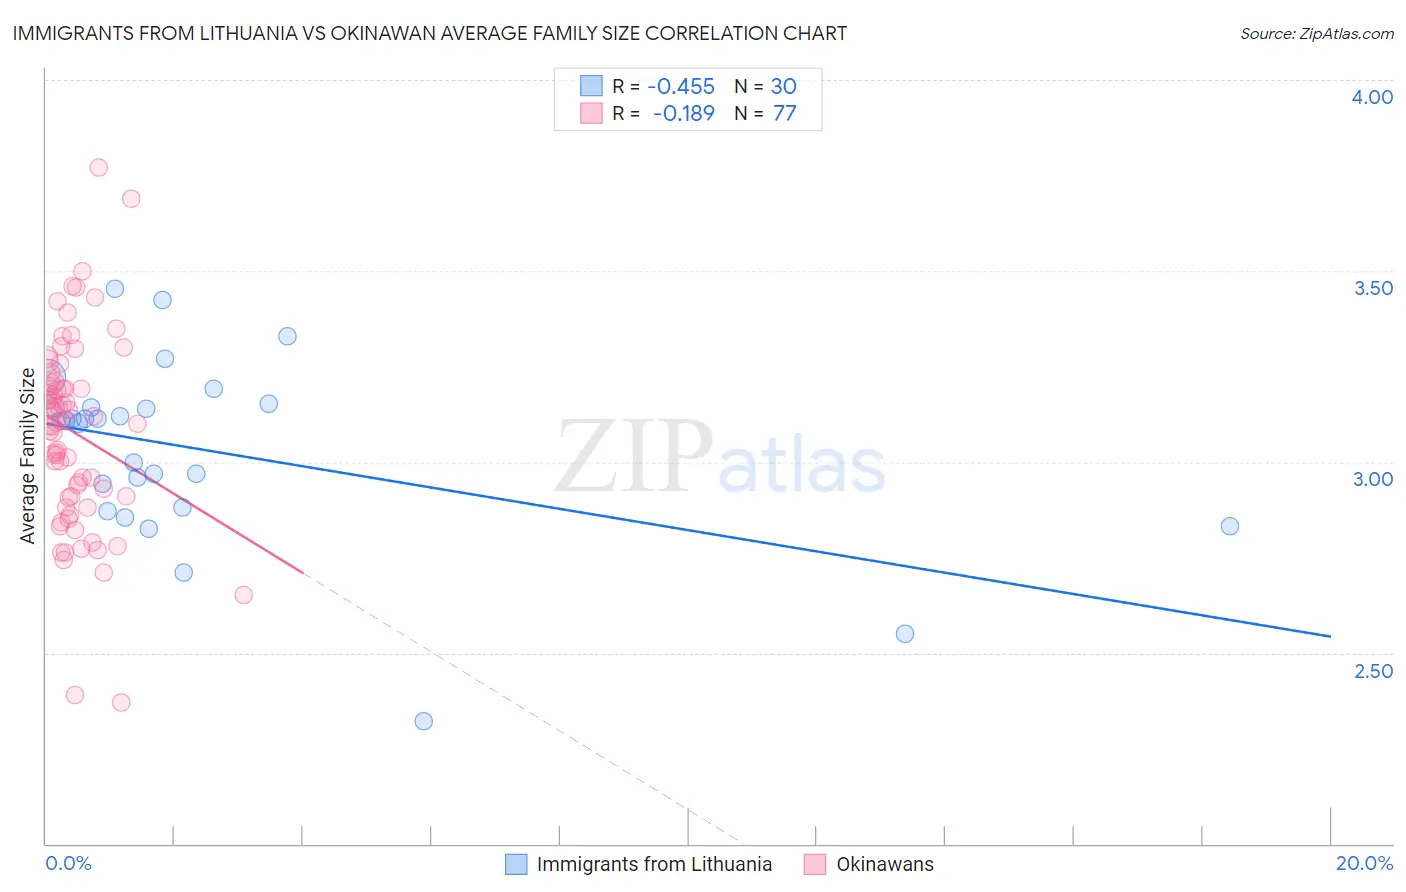
Immigrants from Lithuania vs Okinawan Average Family Size Correlation Chart
The statistical analysis conducted on geographies consisting of 117,713,976 people shows a moderate negative correlation between the proportion of Immigrants from Lithuania and average family size in the United States with a correlation coefficient (R) of -0.455 and weighted average of 3.15. Similarly, the statistical analysis conducted on geographies consisting of 73,730,021 people shows a poor negative correlation between the proportion of Okinawans and average family size in the United States with a correlation coefficient (R) of -0.189 and weighted average of 3.15, a difference of 0.14%.
Average Family Size Correlation Summary
| Measurement | Immigrants from Lithuania | Okinawan |
| Minimum | 2.32 | 2.37 |
| Maximum | 3.45 | 3.77 |
| Range | 1.13 | 1.40 |
| Mean | 3.03 | 3.08 |
| Median | 3.11 | 3.10 |
| Interquartile 25% (IQ1) | 2.88 | 2.91 |
| Interquartile 75% (IQ3) | 3.14 | 3.21 |
| Interquartile Range (IQR) | 0.26 | 0.30 |
| Standard Deviation (Sample) | 0.24 | 0.25 |
| Standard Deviation (Population) | 0.24 | 0.25 |
Demographics Similar to Immigrants from Lithuania and Okinawans by Average Family Size
In terms of average family size, the demographic groups most similar to Immigrants from Lithuania are New Zealander (3.15, a difference of 0.010%), Immigrants from Germany (3.15, a difference of 0.020%), Immigrants from Belgium (3.15, a difference of 0.020%), Cambodian (3.15, a difference of 0.020%), and Tlingit-Haida (3.16, a difference of 0.040%). Similarly, the demographic groups most similar to Okinawans are Immigrants from Europe (3.15, a difference of 0.020%), Swiss (3.15, a difference of 0.030%), Immigrants from Bosnia and Herzegovina (3.15, a difference of 0.040%), Immigrants from England (3.15, a difference of 0.040%), and Immigrants from Denmark (3.15, a difference of 0.080%).
| Demographics | Rating | Rank | Average Family Size |
| Immigrants | South Africa | 0.9 /100 | #265 | Tragic 3.16 |
| Immigrants | Greece | 0.9 /100 | #266 | Tragic 3.16 |
| Iroquois | 0.8 /100 | #267 | Tragic 3.16 |
| Maltese | 0.8 /100 | #268 | Tragic 3.16 |
| Immigrants | Singapore | 0.7 /100 | #269 | Tragic 3.16 |
| Tlingit-Haida | 0.7 /100 | #270 | Tragic 3.16 |
| Immigrants | Germany | 0.7 /100 | #271 | Tragic 3.15 |
| Immigrants | Lithuania | 0.6 /100 | #272 | Tragic 3.15 |
| New Zealanders | 0.6 /100 | #273 | Tragic 3.15 |
| Immigrants | Belgium | 0.6 /100 | #274 | Tragic 3.15 |
| Cambodians | 0.6 /100 | #275 | Tragic 3.15 |
| Immigrants | Bosnia and Herzegovina | 0.5 /100 | #276 | Tragic 3.15 |
| Swiss | 0.5 /100 | #277 | Tragic 3.15 |
| Okinawans | 0.5 /100 | #278 | Tragic 3.15 |
| Immigrants | Europe | 0.5 /100 | #279 | Tragic 3.15 |
| Immigrants | England | 0.4 /100 | #280 | Tragic 3.15 |
| Immigrants | Denmark | 0.4 /100 | #281 | Tragic 3.15 |
| Yugoslavians | 0.4 /100 | #282 | Tragic 3.15 |
| German Russians | 0.4 /100 | #283 | Tragic 3.15 |
| Immigrants | France | 0.4 /100 | #284 | Tragic 3.15 |
| Whites/Caucasians | 0.3 /100 | #285 | Tragic 3.14 |