Nonimmigrants vs Cape Verdean Average Family Size
COMPARE
Nonimmigrants
Cape Verdean
Average Family Size
Average Family Size Comparison
Nonimmigrants
Cape Verdeans
3.19
AVERAGE FAMILY SIZE
5.7/ 100
METRIC RATING
228th/ 347
METRIC RANK
3.17
AVERAGE FAMILY SIZE
1.6/ 100
METRIC RATING
255th/ 347
METRIC RANK
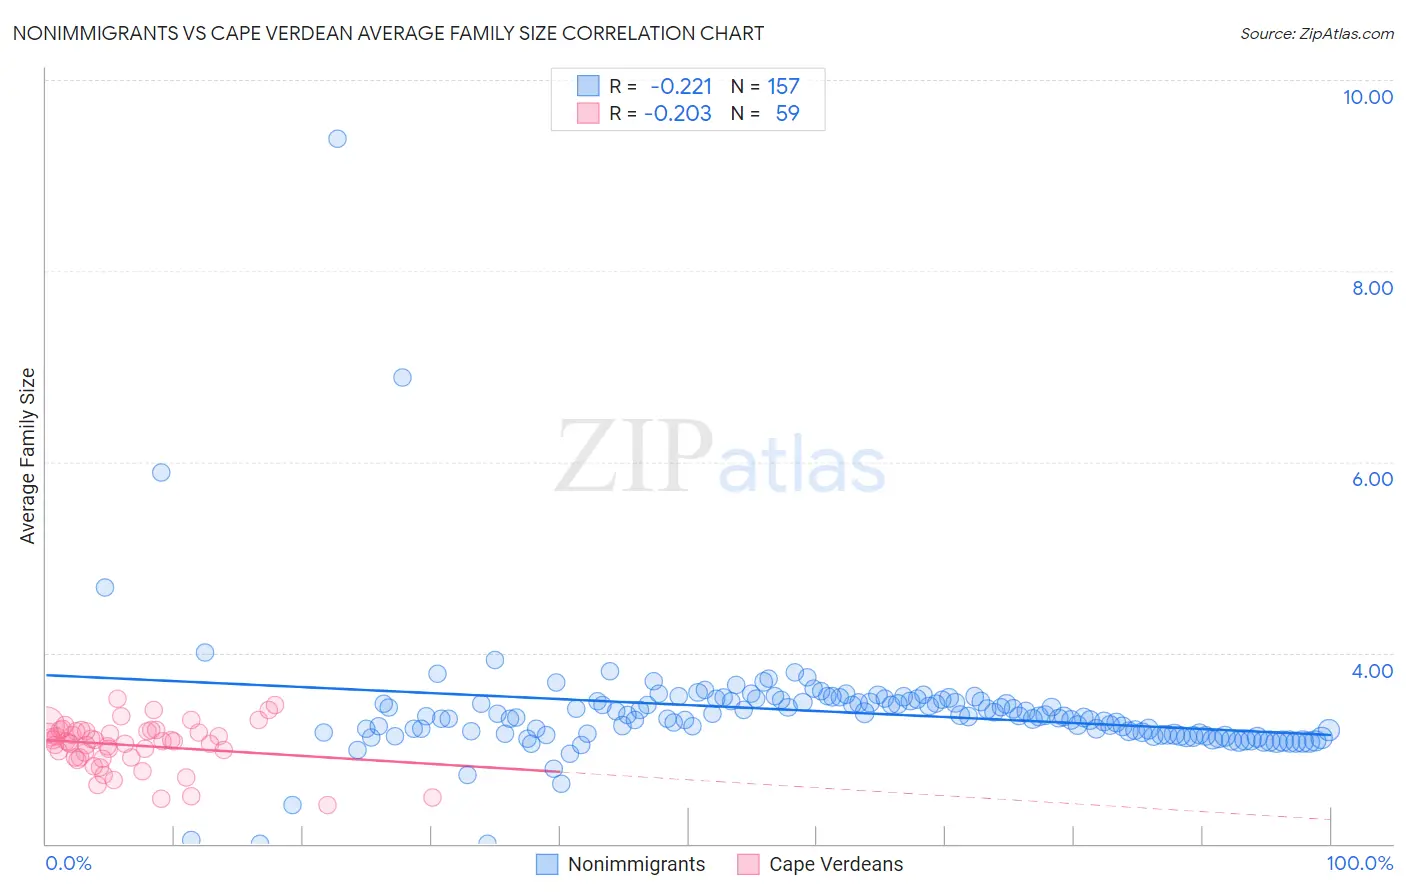
Nonimmigrants vs Cape Verdean Average Family Size Correlation Chart
The statistical analysis conducted on geographies consisting of 584,651,869 people shows a weak negative correlation between the proportion of Nonimmigrants and average family size in the United States with a correlation coefficient (R) of -0.221 and weighted average of 3.19. Similarly, the statistical analysis conducted on geographies consisting of 107,550,345 people shows a weak negative correlation between the proportion of Cape Verdeans and average family size in the United States with a correlation coefficient (R) of -0.203 and weighted average of 3.17, a difference of 0.60%.
Average Family Size Correlation Summary
| Measurement | Nonimmigrants | Cape Verdean |
| Minimum | 2.00 | 2.41 |
| Maximum | 9.38 | 3.52 |
| Range | 7.38 | 1.11 |
| Mean | 3.39 | 3.03 |
| Median | 3.33 | 3.08 |
| Interquartile 25% (IQ1) | 3.14 | 2.91 |
| Interquartile 75% (IQ3) | 3.50 | 3.18 |
| Interquartile Range (IQR) | 0.36 | 0.27 |
| Standard Deviation (Sample) | 0.67 | 0.24 |
| Standard Deviation (Population) | 0.67 | 0.24 |
Similar Demographics by Average Family Size
Demographics Similar to Nonimmigrants by Average Family Size
In terms of average family size, the demographic groups most similar to Nonimmigrants are Portuguese (3.19, a difference of 0.020%), Chickasaw (3.19, a difference of 0.030%), Cree (3.19, a difference of 0.040%), Immigrants from Italy (3.19, a difference of 0.040%), and Icelander (3.19, a difference of 0.050%).
| Demographics | Rating | Rank | Average Family Size |
| Immigrants | Ukraine | 7.2 /100 | #221 | Tragic 3.19 |
| Immigrants | Kuwait | 7.2 /100 | #222 | Tragic 3.19 |
| Immigrants | Zimbabwe | 7.1 /100 | #223 | Tragic 3.19 |
| Syrians | 6.5 /100 | #224 | Tragic 3.19 |
| Cree | 6.2 /100 | #225 | Tragic 3.19 |
| Chickasaw | 6.0 /100 | #226 | Tragic 3.19 |
| Portuguese | 6.0 /100 | #227 | Tragic 3.19 |
| Immigrants | Nonimmigrants | 5.7 /100 | #228 | Tragic 3.19 |
| Immigrants | Italy | 5.3 /100 | #229 | Tragic 3.19 |
| Icelanders | 5.2 /100 | #230 | Tragic 3.19 |
| Basques | 5.2 /100 | #231 | Tragic 3.19 |
| Cherokee | 4.7 /100 | #232 | Tragic 3.18 |
| Brazilians | 4.5 /100 | #233 | Tragic 3.18 |
| Iranians | 4.5 /100 | #234 | Tragic 3.18 |
| Immigrants | Turkey | 4.2 /100 | #235 | Tragic 3.18 |
Demographics Similar to Cape Verdeans by Average Family Size
In terms of average family size, the demographic groups most similar to Cape Verdeans are Immigrants from Hungary (3.17, a difference of 0.010%), Immigrants from Saudi Arabia (3.17, a difference of 0.020%), South African (3.17, a difference of 0.020%), Immigrants from Kazakhstan (3.17, a difference of 0.030%), and Immigrants from Spain (3.17, a difference of 0.050%).
| Demographics | Rating | Rank | Average Family Size |
| Immigrants | Belarus | 2.3 /100 | #248 | Tragic 3.17 |
| Immigrants | Eastern Europe | 2.1 /100 | #249 | Tragic 3.17 |
| Puget Sound Salish | 1.9 /100 | #250 | Tragic 3.17 |
| Immigrants | Spain | 1.8 /100 | #251 | Tragic 3.17 |
| Immigrants | Saudi Arabia | 1.7 /100 | #252 | Tragic 3.17 |
| South Africans | 1.7 /100 | #253 | Tragic 3.17 |
| Immigrants | Hungary | 1.7 /100 | #254 | Tragic 3.17 |
| Cape Verdeans | 1.6 /100 | #255 | Tragic 3.17 |
| Immigrants | Kazakhstan | 1.5 /100 | #256 | Tragic 3.17 |
| Albanians | 1.5 /100 | #257 | Tragic 3.17 |
| Turks | 1.3 /100 | #258 | Tragic 3.16 |
| Potawatomi | 1.3 /100 | #259 | Tragic 3.16 |
| Immigrants | Albania | 1.3 /100 | #260 | Tragic 3.16 |
| Immigrants | North Macedonia | 1.3 /100 | #261 | Tragic 3.16 |
| Immigrants | Russia | 1.3 /100 | #262 | Tragic 3.16 |