U.S. Virgin Islander vs Cape Verdean Average Family Size
COMPARE
U.S. Virgin Islander
Cape Verdean
Average Family Size
Average Family Size Comparison
U.S. Virgin Islanders
Cape Verdeans
3.29
AVERAGE FAMILY SIZE
98.8/ 100
METRIC RATING
96th/ 347
METRIC RANK
3.17
AVERAGE FAMILY SIZE
1.6/ 100
METRIC RATING
255th/ 347
METRIC RANK
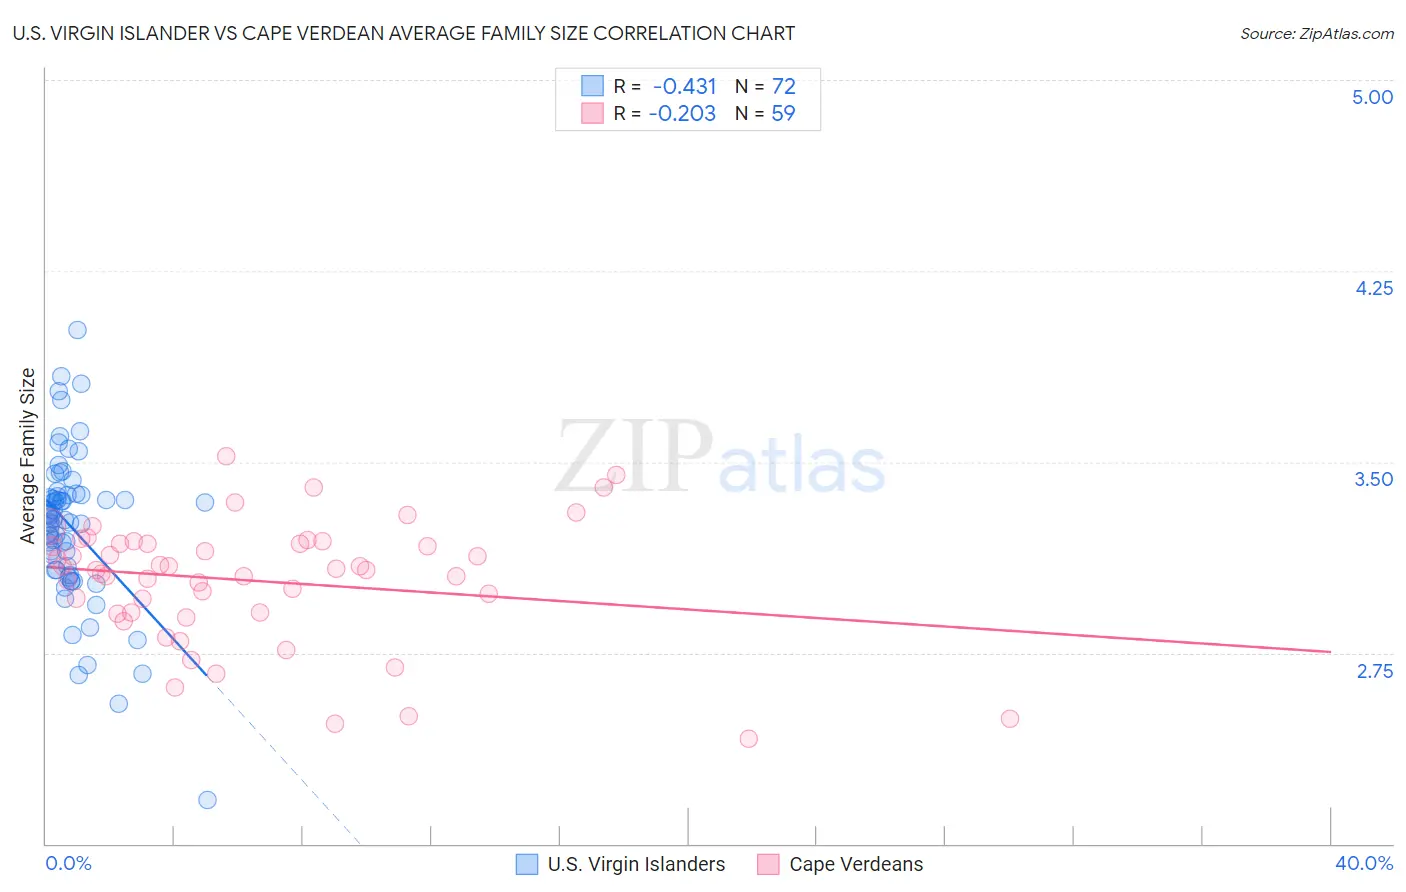
U.S. Virgin Islander vs Cape Verdean Average Family Size Correlation Chart
The statistical analysis conducted on geographies consisting of 87,507,759 people shows a moderate negative correlation between the proportion of U.S. Virgin Islanders and average family size in the United States with a correlation coefficient (R) of -0.431 and weighted average of 3.29. Similarly, the statistical analysis conducted on geographies consisting of 107,550,345 people shows a weak negative correlation between the proportion of Cape Verdeans and average family size in the United States with a correlation coefficient (R) of -0.203 and weighted average of 3.17, a difference of 3.9%.
Average Family Size Correlation Summary
| Measurement | U.S. Virgin Islander | Cape Verdean |
| Minimum | 2.17 | 2.41 |
| Maximum | 4.02 | 3.52 |
| Range | 1.85 | 1.11 |
| Mean | 3.24 | 3.03 |
| Median | 3.27 | 3.08 |
| Interquartile 25% (IQ1) | 3.08 | 2.91 |
| Interquartile 75% (IQ3) | 3.37 | 3.18 |
| Interquartile Range (IQR) | 0.29 | 0.27 |
| Standard Deviation (Sample) | 0.30 | 0.24 |
| Standard Deviation (Population) | 0.30 | 0.24 |
Similar Demographics by Average Family Size
Demographics Similar to U.S. Virgin Islanders by Average Family Size
In terms of average family size, the demographic groups most similar to U.S. Virgin Islanders are Immigrants from Oceania (3.29, a difference of 0.040%), Barbadian (3.29, a difference of 0.040%), Nigerian (3.29, a difference of 0.050%), Guamanian/Chamorro (3.29, a difference of 0.050%), and Immigrants from Burma/Myanmar (3.29, a difference of 0.070%).
| Demographics | Rating | Rank | Average Family Size |
| Malaysians | 99.6 /100 | #89 | Exceptional 3.31 |
| Menominee | 99.4 /100 | #90 | Exceptional 3.30 |
| Immigrants | Pakistan | 99.2 /100 | #91 | Exceptional 3.30 |
| Immigrants | Cameroon | 99.2 /100 | #92 | Exceptional 3.30 |
| Peruvians | 99.2 /100 | #93 | Exceptional 3.30 |
| Sierra Leoneans | 99.0 /100 | #94 | Exceptional 3.30 |
| Immigrants | Lebanon | 99.0 /100 | #95 | Exceptional 3.30 |
| U.S. Virgin Islanders | 98.8 /100 | #96 | Exceptional 3.29 |
| Immigrants | Oceania | 98.7 /100 | #97 | Exceptional 3.29 |
| Barbadians | 98.6 /100 | #98 | Exceptional 3.29 |
| Nigerians | 98.6 /100 | #99 | Exceptional 3.29 |
| Guamanians/Chamorros | 98.6 /100 | #100 | Exceptional 3.29 |
| Immigrants | Burma/Myanmar | 98.6 /100 | #101 | Exceptional 3.29 |
| West Indians | 98.5 /100 | #102 | Exceptional 3.29 |
| Immigrants | Western Africa | 98.4 /100 | #103 | Exceptional 3.29 |
Demographics Similar to Cape Verdeans by Average Family Size
In terms of average family size, the demographic groups most similar to Cape Verdeans are Immigrants from Hungary (3.17, a difference of 0.010%), Immigrants from Saudi Arabia (3.17, a difference of 0.020%), South African (3.17, a difference of 0.020%), Immigrants from Kazakhstan (3.17, a difference of 0.030%), and Immigrants from Spain (3.17, a difference of 0.050%).
| Demographics | Rating | Rank | Average Family Size |
| Immigrants | Belarus | 2.3 /100 | #248 | Tragic 3.17 |
| Immigrants | Eastern Europe | 2.1 /100 | #249 | Tragic 3.17 |
| Puget Sound Salish | 1.9 /100 | #250 | Tragic 3.17 |
| Immigrants | Spain | 1.8 /100 | #251 | Tragic 3.17 |
| Immigrants | Saudi Arabia | 1.7 /100 | #252 | Tragic 3.17 |
| South Africans | 1.7 /100 | #253 | Tragic 3.17 |
| Immigrants | Hungary | 1.7 /100 | #254 | Tragic 3.17 |
| Cape Verdeans | 1.6 /100 | #255 | Tragic 3.17 |
| Immigrants | Kazakhstan | 1.5 /100 | #256 | Tragic 3.17 |
| Albanians | 1.5 /100 | #257 | Tragic 3.17 |
| Turks | 1.3 /100 | #258 | Tragic 3.16 |
| Potawatomi | 1.3 /100 | #259 | Tragic 3.16 |
| Immigrants | Albania | 1.3 /100 | #260 | Tragic 3.16 |
| Immigrants | North Macedonia | 1.3 /100 | #261 | Tragic 3.16 |
| Immigrants | Russia | 1.3 /100 | #262 | Tragic 3.16 |