Lithuanian vs Cape Verdean Average Family Size
COMPARE
Lithuanian
Cape Verdean
Average Family Size
Average Family Size Comparison
Lithuanians
Cape Verdeans
3.10
AVERAGE FAMILY SIZE
0.0/ 100
METRIC RATING
334th/ 347
METRIC RANK
3.17
AVERAGE FAMILY SIZE
1.6/ 100
METRIC RATING
255th/ 347
METRIC RANK
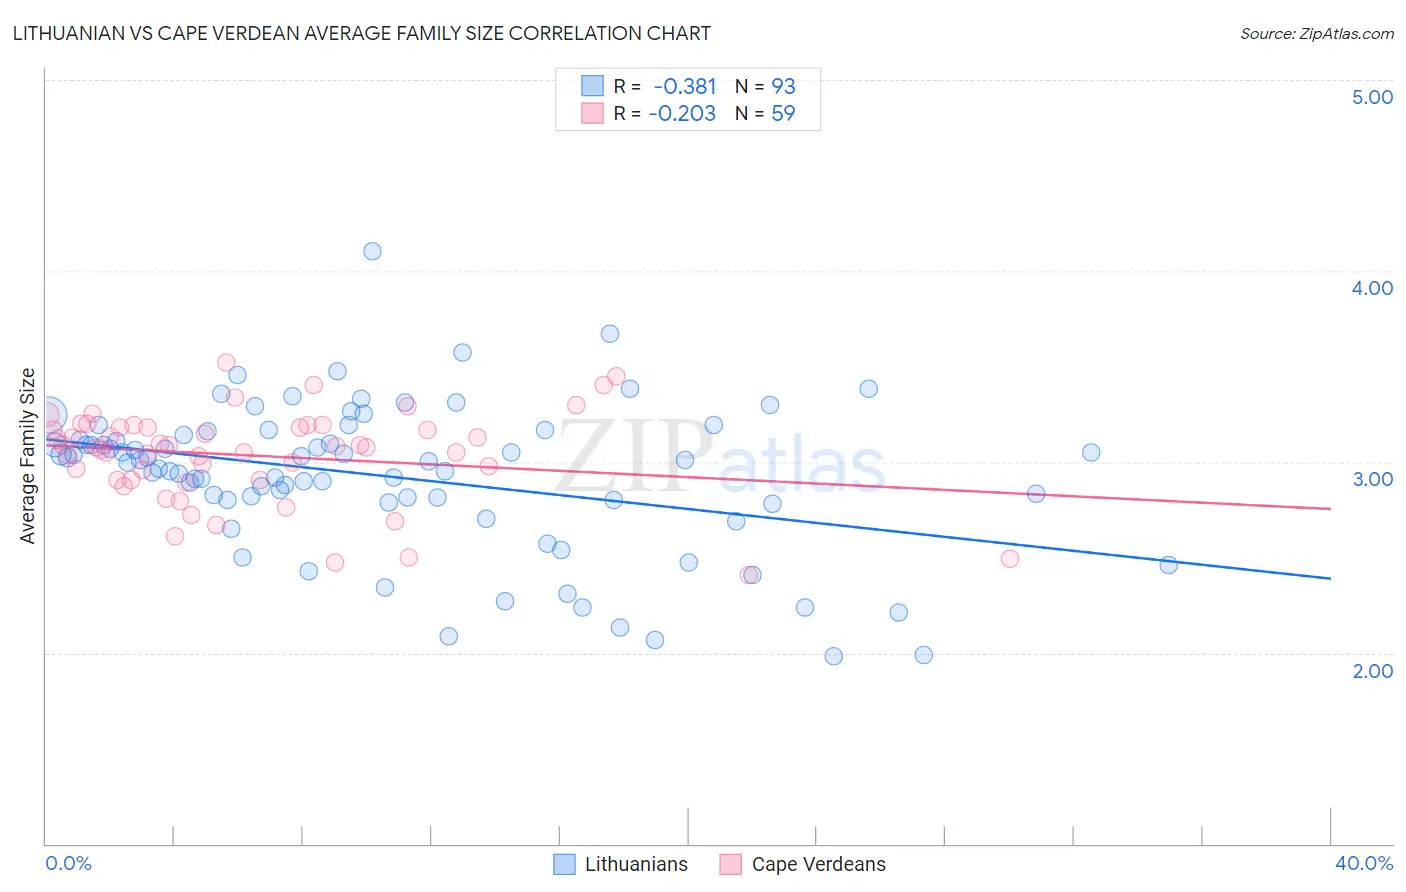
Lithuanian vs Cape Verdean Average Family Size Correlation Chart
The statistical analysis conducted on geographies consisting of 421,743,264 people shows a mild negative correlation between the proportion of Lithuanians and average family size in the United States with a correlation coefficient (R) of -0.381 and weighted average of 3.10. Similarly, the statistical analysis conducted on geographies consisting of 107,550,345 people shows a weak negative correlation between the proportion of Cape Verdeans and average family size in the United States with a correlation coefficient (R) of -0.203 and weighted average of 3.17, a difference of 2.1%.
Average Family Size Correlation Summary
| Measurement | Lithuanian | Cape Verdean |
| Minimum | 1.98 | 2.41 |
| Maximum | 4.10 | 3.52 |
| Range | 2.12 | 1.11 |
| Mean | 2.92 | 3.03 |
| Median | 3.00 | 3.08 |
| Interquartile 25% (IQ1) | 2.79 | 2.91 |
| Interquartile 75% (IQ3) | 3.15 | 3.18 |
| Interquartile Range (IQR) | 0.36 | 0.27 |
| Standard Deviation (Sample) | 0.39 | 0.24 |
| Standard Deviation (Population) | 0.38 | 0.24 |
Similar Demographics by Average Family Size
Demographics Similar to Lithuanians by Average Family Size
In terms of average family size, the demographic groups most similar to Lithuanians are Estonian (3.10, a difference of 0.0%), Luxembourger (3.10, a difference of 0.030%), Scotch-Irish (3.11, a difference of 0.050%), Scottish (3.11, a difference of 0.050%), and Latvian (3.11, a difference of 0.060%).
| Demographics | Rating | Rank | Average Family Size |
| Dutch | 0.0 /100 | #327 | Tragic 3.11 |
| Czechs | 0.0 /100 | #328 | Tragic 3.11 |
| Belgians | 0.0 /100 | #329 | Tragic 3.11 |
| Latvians | 0.0 /100 | #330 | Tragic 3.11 |
| Scotch-Irish | 0.0 /100 | #331 | Tragic 3.11 |
| Scottish | 0.0 /100 | #332 | Tragic 3.11 |
| Estonians | 0.0 /100 | #333 | Tragic 3.10 |
| Lithuanians | 0.0 /100 | #334 | Tragic 3.10 |
| Luxembourgers | 0.0 /100 | #335 | Tragic 3.10 |
| Irish | 0.0 /100 | #336 | Tragic 3.10 |
| Swedes | 0.0 /100 | #337 | Tragic 3.10 |
| French | 0.0 /100 | #338 | Tragic 3.10 |
| Croatians | 0.0 /100 | #339 | Tragic 3.10 |
| Finns | 0.0 /100 | #340 | Tragic 3.09 |
| Poles | 0.0 /100 | #341 | Tragic 3.09 |
Demographics Similar to Cape Verdeans by Average Family Size
In terms of average family size, the demographic groups most similar to Cape Verdeans are Immigrants from Hungary (3.17, a difference of 0.010%), Immigrants from Saudi Arabia (3.17, a difference of 0.020%), South African (3.17, a difference of 0.020%), Immigrants from Kazakhstan (3.17, a difference of 0.030%), and Immigrants from Spain (3.17, a difference of 0.050%).
| Demographics | Rating | Rank | Average Family Size |
| Immigrants | Belarus | 2.3 /100 | #248 | Tragic 3.17 |
| Immigrants | Eastern Europe | 2.1 /100 | #249 | Tragic 3.17 |
| Puget Sound Salish | 1.9 /100 | #250 | Tragic 3.17 |
| Immigrants | Spain | 1.8 /100 | #251 | Tragic 3.17 |
| Immigrants | Saudi Arabia | 1.7 /100 | #252 | Tragic 3.17 |
| South Africans | 1.7 /100 | #253 | Tragic 3.17 |
| Immigrants | Hungary | 1.7 /100 | #254 | Tragic 3.17 |
| Cape Verdeans | 1.6 /100 | #255 | Tragic 3.17 |
| Immigrants | Kazakhstan | 1.5 /100 | #256 | Tragic 3.17 |
| Albanians | 1.5 /100 | #257 | Tragic 3.17 |
| Turks | 1.3 /100 | #258 | Tragic 3.16 |
| Potawatomi | 1.3 /100 | #259 | Tragic 3.16 |
| Immigrants | Albania | 1.3 /100 | #260 | Tragic 3.16 |
| Immigrants | North Macedonia | 1.3 /100 | #261 | Tragic 3.16 |
| Immigrants | Russia | 1.3 /100 | #262 | Tragic 3.16 |