Samoan vs Cherokee Family Households
COMPARE
Samoan
Cherokee
Family Households
Family Households Comparison
Samoans
Cherokee
67.9%
FAMILY HOUSEHOLDS
100.0/ 100
METRIC RATING
19th/ 347
METRIC RANK
65.0%
FAMILY HOUSEHOLDS
95.3/ 100
METRIC RATING
117th/ 347
METRIC RANK
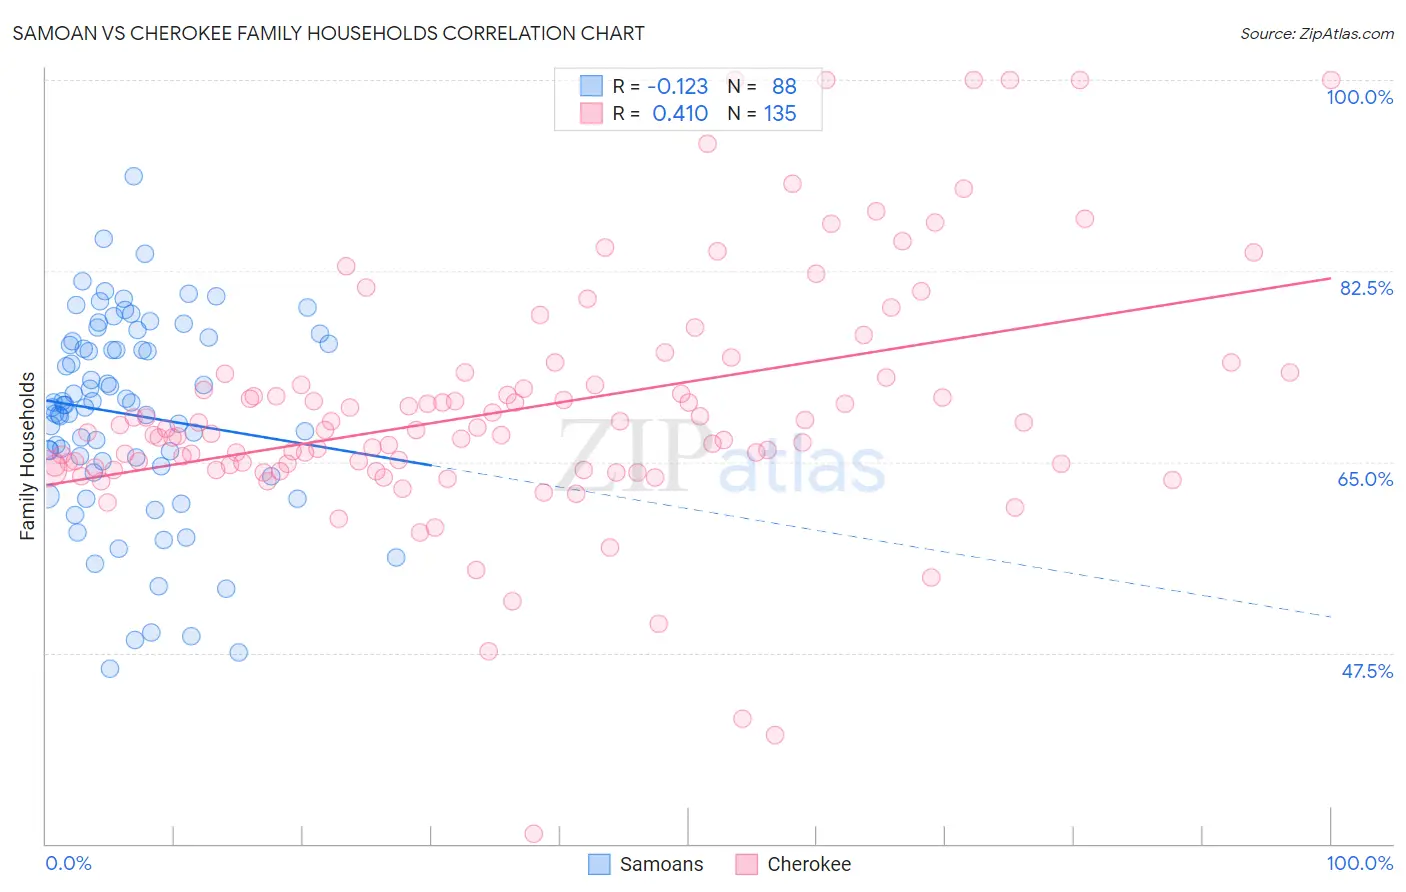
Samoan vs Cherokee Family Households Correlation Chart
The statistical analysis conducted on geographies consisting of 225,071,820 people shows a poor negative correlation between the proportion of Samoans and percentage of family households in the United States with a correlation coefficient (R) of -0.123 and weighted average of 67.9%. Similarly, the statistical analysis conducted on geographies consisting of 493,383,151 people shows a moderate positive correlation between the proportion of Cherokee and percentage of family households in the United States with a correlation coefficient (R) of 0.410 and weighted average of 65.0%, a difference of 4.6%.
Family Households Correlation Summary
| Measurement | Samoan | Cherokee |
| Minimum | 46.0% | 31.0% |
| Maximum | 91.2% | 100.0% |
| Range | 45.2% | 69.0% |
| Mean | 69.3% | 69.9% |
| Median | 70.2% | 67.9% |
| Interquartile 25% (IQ1) | 64.8% | 64.5% |
| Interquartile 75% (IQ3) | 75.9% | 72.7% |
| Interquartile Range (IQR) | 11.1% | 8.2% |
| Standard Deviation (Sample) | 9.1% | 11.2% |
| Standard Deviation (Population) | 9.1% | 11.2% |
Similar Demographics by Family Households
Demographics Similar to Samoans by Family Households
In terms of family households, the demographic groups most similar to Samoans are Immigrants from Taiwan (68.0%, a difference of 0.12%), Inupiat (67.8%, a difference of 0.25%), Chinese (68.1%, a difference of 0.28%), Cuban (67.7%, a difference of 0.30%), and Assyrian/Chaldean/Syriac (68.2%, a difference of 0.32%).
| Demographics | Rating | Rank | Family Households |
| Koreans | 100.0 /100 | #12 | Exceptional 68.3% |
| Pueblo | 100.0 /100 | #13 | Exceptional 68.2% |
| Immigrants | Cuba | 100.0 /100 | #14 | Exceptional 68.2% |
| Assyrians/Chaldeans/Syriacs | 100.0 /100 | #15 | Exceptional 68.2% |
| Immigrants | Vietnam | 100.0 /100 | #16 | Exceptional 68.2% |
| Chinese | 100.0 /100 | #17 | Exceptional 68.1% |
| Immigrants | Taiwan | 100.0 /100 | #18 | Exceptional 68.0% |
| Samoans | 100.0 /100 | #19 | Exceptional 67.9% |
| Inupiat | 100.0 /100 | #20 | Exceptional 67.8% |
| Cubans | 100.0 /100 | #21 | Exceptional 67.7% |
| Sri Lankans | 100.0 /100 | #22 | Exceptional 67.7% |
| Immigrants | Pakistan | 100.0 /100 | #23 | Exceptional 67.7% |
| Immigrants | South Eastern Asia | 100.0 /100 | #24 | Exceptional 67.5% |
| Immigrants | Nicaragua | 100.0 /100 | #25 | Exceptional 67.5% |
| Immigrants | India | 100.0 /100 | #26 | Exceptional 67.4% |
Demographics Similar to Cherokee by Family Households
In terms of family households, the demographic groups most similar to Cherokee are Immigrants from Iraq (65.0%, a difference of 0.0%), Ecuadorian (65.0%, a difference of 0.010%), Dutch (64.9%, a difference of 0.020%), Argentinean (65.0%, a difference of 0.030%), and Immigrants from Eastern Asia (64.9%, a difference of 0.060%).
| Demographics | Rating | Rank | Family Households |
| Scandinavians | 96.8 /100 | #110 | Exceptional 65.0% |
| Europeans | 96.8 /100 | #111 | Exceptional 65.0% |
| Immigrants | Jordan | 96.5 /100 | #112 | Exceptional 65.0% |
| Spanish | 96.2 /100 | #113 | Exceptional 65.0% |
| Argentineans | 95.7 /100 | #114 | Exceptional 65.0% |
| Ecuadorians | 95.4 /100 | #115 | Exceptional 65.0% |
| Immigrants | Iraq | 95.4 /100 | #116 | Exceptional 65.0% |
| Cherokee | 95.3 /100 | #117 | Exceptional 65.0% |
| Dutch | 95.1 /100 | #118 | Exceptional 64.9% |
| Immigrants | Eastern Asia | 94.4 /100 | #119 | Exceptional 64.9% |
| Immigrants | Oceania | 94.2 /100 | #120 | Exceptional 64.9% |
| Hungarians | 94.0 /100 | #121 | Exceptional 64.9% |
| Hmong | 93.4 /100 | #122 | Exceptional 64.9% |
| Choctaw | 93.4 /100 | #123 | Exceptional 64.9% |
| Immigrants | Argentina | 92.8 /100 | #124 | Exceptional 64.9% |