Samoan vs Immigrants from South America Family Households
COMPARE
Samoan
Immigrants from South America
Family Households
Family Households Comparison
Samoans
Immigrants from South America
67.9%
FAMILY HOUSEHOLDS
100.0/ 100
METRIC RATING
19th/ 347
METRIC RANK
65.6%
FAMILY HOUSEHOLDS
99.8/ 100
METRIC RATING
77th/ 347
METRIC RANK
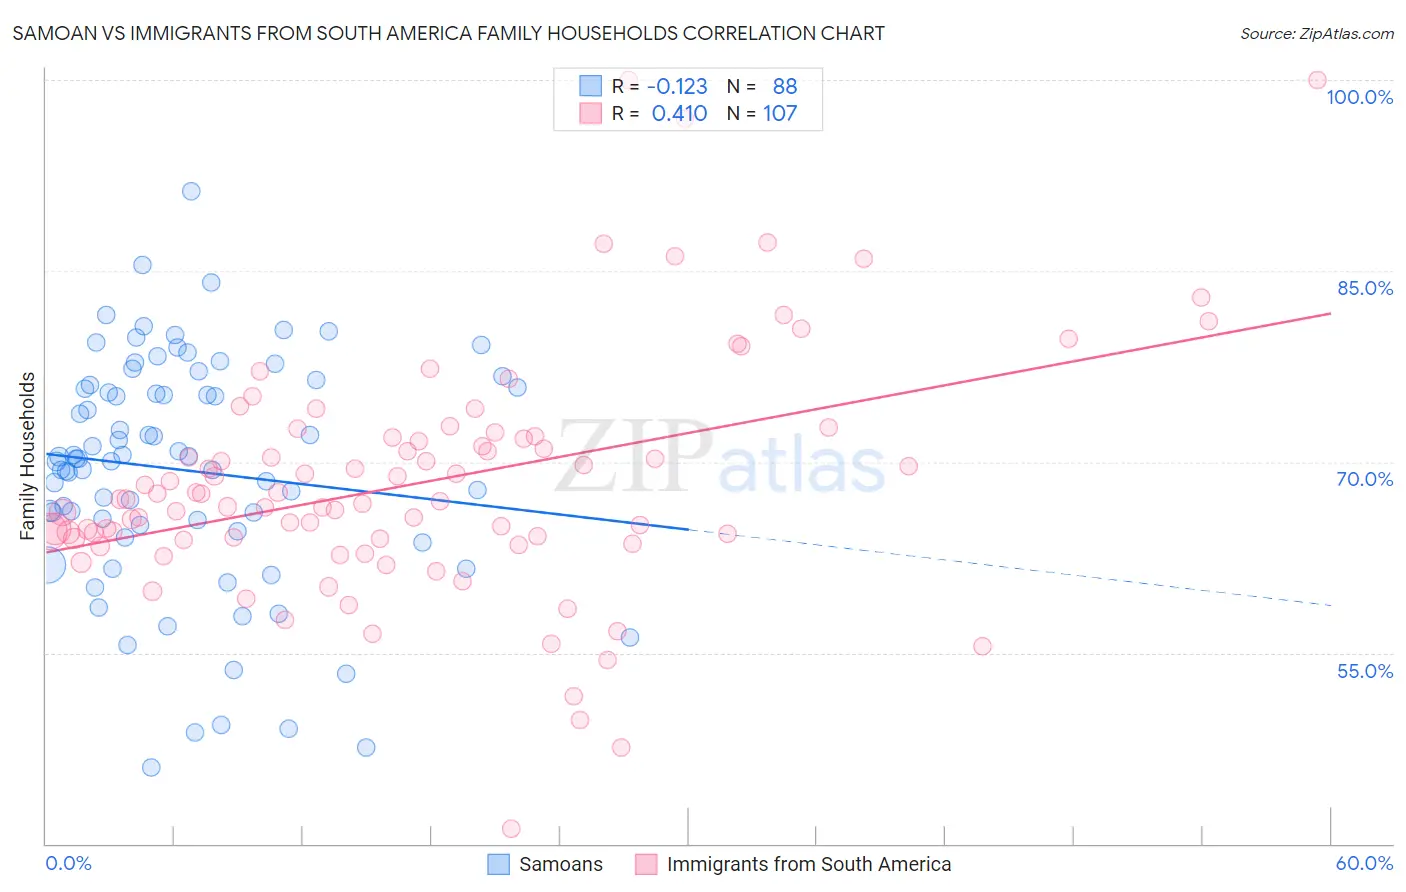
Samoan vs Immigrants from South America Family Households Correlation Chart
The statistical analysis conducted on geographies consisting of 225,071,820 people shows a poor negative correlation between the proportion of Samoans and percentage of family households in the United States with a correlation coefficient (R) of -0.123 and weighted average of 67.9%. Similarly, the statistical analysis conducted on geographies consisting of 486,016,991 people shows a moderate positive correlation between the proportion of Immigrants from South America and percentage of family households in the United States with a correlation coefficient (R) of 0.410 and weighted average of 65.6%, a difference of 3.5%.
Family Households Correlation Summary
| Measurement | Samoan | Immigrants from South America |
| Minimum | 46.0% | 41.2% |
| Maximum | 91.2% | 100.0% |
| Range | 45.2% | 58.8% |
| Mean | 69.3% | 68.4% |
| Median | 70.2% | 67.1% |
| Interquartile 25% (IQ1) | 64.8% | 64.0% |
| Interquartile 75% (IQ3) | 75.9% | 71.9% |
| Interquartile Range (IQR) | 11.1% | 8.0% |
| Standard Deviation (Sample) | 9.1% | 9.5% |
| Standard Deviation (Population) | 9.1% | 9.4% |
Similar Demographics by Family Households
Demographics Similar to Samoans by Family Households
In terms of family households, the demographic groups most similar to Samoans are Immigrants from Taiwan (68.0%, a difference of 0.12%), Inupiat (67.8%, a difference of 0.25%), Chinese (68.1%, a difference of 0.28%), Cuban (67.7%, a difference of 0.30%), and Assyrian/Chaldean/Syriac (68.2%, a difference of 0.32%).
| Demographics | Rating | Rank | Family Households |
| Koreans | 100.0 /100 | #12 | Exceptional 68.3% |
| Pueblo | 100.0 /100 | #13 | Exceptional 68.2% |
| Immigrants | Cuba | 100.0 /100 | #14 | Exceptional 68.2% |
| Assyrians/Chaldeans/Syriacs | 100.0 /100 | #15 | Exceptional 68.2% |
| Immigrants | Vietnam | 100.0 /100 | #16 | Exceptional 68.2% |
| Chinese | 100.0 /100 | #17 | Exceptional 68.1% |
| Immigrants | Taiwan | 100.0 /100 | #18 | Exceptional 68.0% |
| Samoans | 100.0 /100 | #19 | Exceptional 67.9% |
| Inupiat | 100.0 /100 | #20 | Exceptional 67.8% |
| Cubans | 100.0 /100 | #21 | Exceptional 67.7% |
| Sri Lankans | 100.0 /100 | #22 | Exceptional 67.7% |
| Immigrants | Pakistan | 100.0 /100 | #23 | Exceptional 67.7% |
| Immigrants | South Eastern Asia | 100.0 /100 | #24 | Exceptional 67.5% |
| Immigrants | Nicaragua | 100.0 /100 | #25 | Exceptional 67.5% |
| Immigrants | India | 100.0 /100 | #26 | Exceptional 67.4% |
Demographics Similar to Immigrants from South America by Family Households
In terms of family households, the demographic groups most similar to Immigrants from South America are Yaqui (65.6%, a difference of 0.0%), Immigrants from the Azores (65.6%, a difference of 0.010%), Immigrants from Costa Rica (65.6%, a difference of 0.040%), Puget Sound Salish (65.6%, a difference of 0.050%), and Houma (65.7%, a difference of 0.12%).
| Demographics | Rating | Rank | Family Households |
| Immigrants | Afghanistan | 99.9 /100 | #70 | Exceptional 65.9% |
| Bhutanese | 99.9 /100 | #71 | Exceptional 65.9% |
| Portuguese | 99.9 /100 | #72 | Exceptional 65.8% |
| Laotians | 99.9 /100 | #73 | Exceptional 65.8% |
| Burmese | 99.9 /100 | #74 | Exceptional 65.7% |
| Houma | 99.9 /100 | #75 | Exceptional 65.7% |
| Immigrants | Azores | 99.8 /100 | #76 | Exceptional 65.6% |
| Immigrants | South America | 99.8 /100 | #77 | Exceptional 65.6% |
| Yaqui | 99.8 /100 | #78 | Exceptional 65.6% |
| Immigrants | Costa Rica | 99.8 /100 | #79 | Exceptional 65.6% |
| Puget Sound Salish | 99.8 /100 | #80 | Exceptional 65.6% |
| Jordanians | 99.7 /100 | #81 | Exceptional 65.5% |
| Immigrants | Lebanon | 99.7 /100 | #82 | Exceptional 65.5% |
| Immigrants | Guyana | 99.6 /100 | #83 | Exceptional 65.5% |
| Americans | 99.6 /100 | #84 | Exceptional 65.5% |