Puget Sound Salish vs Immigrants from Ireland Married-couple Households
COMPARE
Puget Sound Salish
Immigrants from Ireland
Married-couple Households
Married-couple Households Comparison
Puget Sound Salish
Immigrants from Ireland
47.4%
MARRIED-COUPLE HOUSEHOLDS
90.5/ 100
METRIC RATING
120th/ 347
METRIC RANK
48.0%
MARRIED-COUPLE HOUSEHOLDS
97.3/ 100
METRIC RATING
87th/ 347
METRIC RANK
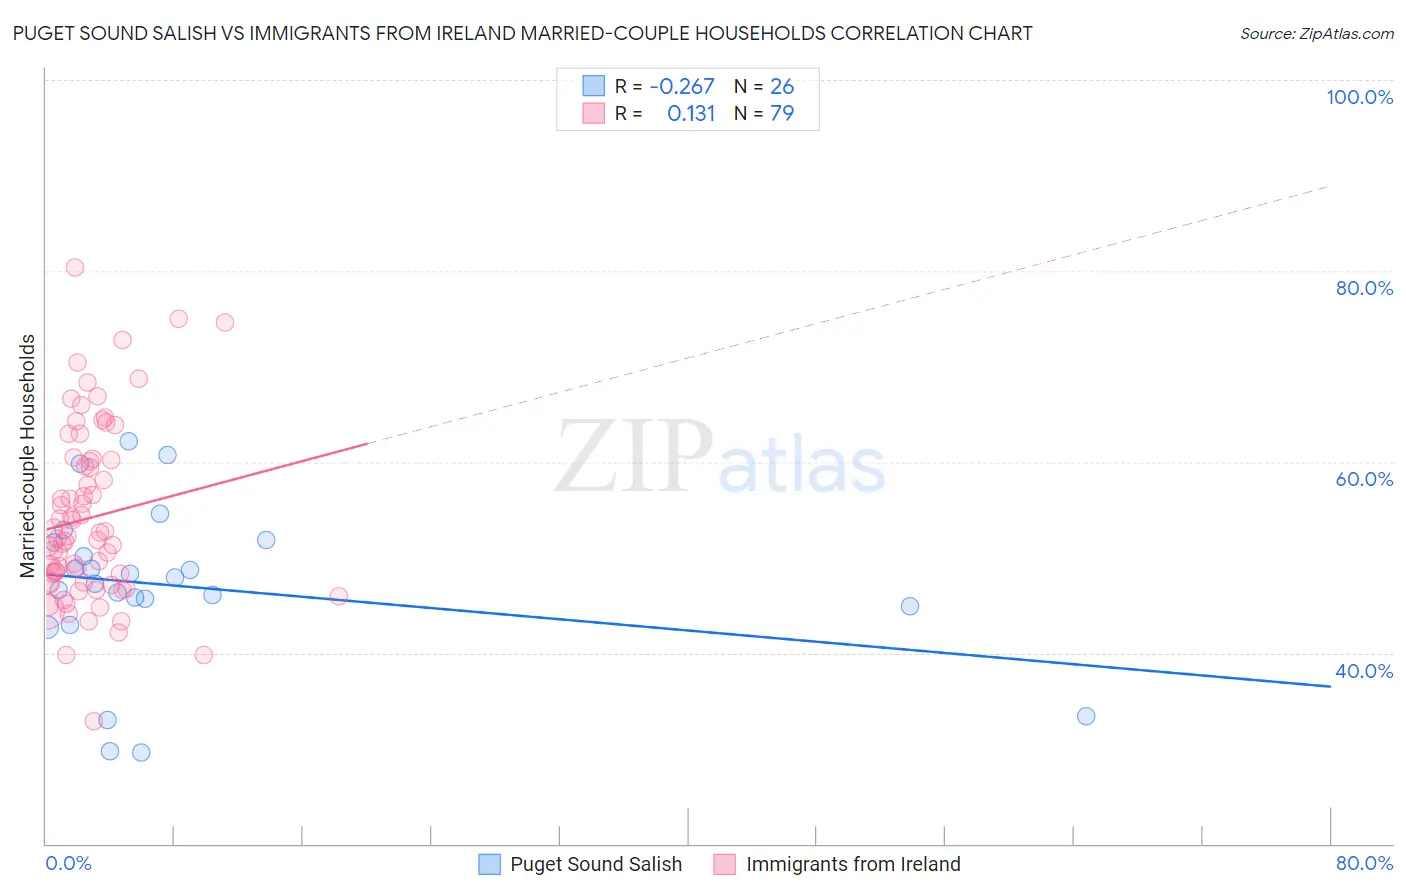
Puget Sound Salish vs Immigrants from Ireland Married-couple Households Correlation Chart
The statistical analysis conducted on geographies consisting of 46,155,865 people shows a weak negative correlation between the proportion of Puget Sound Salish and percentage of married-couple family households in the United States with a correlation coefficient (R) of -0.267 and weighted average of 47.4%. Similarly, the statistical analysis conducted on geographies consisting of 240,743,344 people shows a poor positive correlation between the proportion of Immigrants from Ireland and percentage of married-couple family households in the United States with a correlation coefficient (R) of 0.131 and weighted average of 48.0%, a difference of 1.2%.
Married-couple Households Correlation Summary
| Measurement | Puget Sound Salish | Immigrants from Ireland |
| Minimum | 29.5% | 32.8% |
| Maximum | 62.2% | 80.3% |
| Range | 32.7% | 47.5% |
| Mean | 46.9% | 54.1% |
| Median | 47.6% | 51.9% |
| Interquartile 25% (IQ1) | 44.8% | 47.4% |
| Interquartile 75% (IQ3) | 51.6% | 60.2% |
| Interquartile Range (IQR) | 6.8% | 12.8% |
| Standard Deviation (Sample) | 8.4% | 9.2% |
| Standard Deviation (Population) | 8.3% | 9.1% |
Similar Demographics by Married-couple Households
Demographics Similar to Puget Sound Salish by Married-couple Households
In terms of married-couple households, the demographic groups most similar to Puget Sound Salish are Immigrants from Eastern Europe (47.4%, a difference of 0.020%), Okinawan (47.4%, a difference of 0.040%), Immigrants from Venezuela (47.4%, a difference of 0.13%), Zimbabwean (47.4%, a difference of 0.14%), and Australian (47.4%, a difference of 0.16%).
| Demographics | Rating | Rank | Married-couple Households |
| Venezuelans | 93.8 /100 | #113 | Exceptional 47.6% |
| Immigrants | Europe | 93.7 /100 | #114 | Exceptional 47.6% |
| Slovaks | 92.9 /100 | #115 | Exceptional 47.6% |
| Argentineans | 92.5 /100 | #116 | Exceptional 47.5% |
| French Canadians | 92.4 /100 | #117 | Exceptional 47.5% |
| Immigrants | Germany | 92.4 /100 | #118 | Exceptional 47.5% |
| Chileans | 92.2 /100 | #119 | Exceptional 47.5% |
| Puget Sound Salish | 90.5 /100 | #120 | Exceptional 47.4% |
| Immigrants | Eastern Europe | 90.3 /100 | #121 | Exceptional 47.4% |
| Okinawans | 90.1 /100 | #122 | Exceptional 47.4% |
| Immigrants | Venezuela | 89.3 /100 | #123 | Excellent 47.4% |
| Zimbabweans | 89.2 /100 | #124 | Excellent 47.4% |
| Australians | 89.0 /100 | #125 | Excellent 47.4% |
| Pakistanis | 88.6 /100 | #126 | Excellent 47.3% |
| Celtics | 88.1 /100 | #127 | Excellent 47.3% |
Demographics Similar to Immigrants from Ireland by Married-couple Households
In terms of married-couple households, the demographic groups most similar to Immigrants from Ireland are Afghan (48.0%, a difference of 0.0%), Belgian (48.0%, a difference of 0.010%), Cypriot (48.0%, a difference of 0.030%), Immigrants from Israel (48.0%, a difference of 0.040%), and French (48.0%, a difference of 0.050%).
| Demographics | Rating | Rank | Married-couple Households |
| Russians | 98.1 /100 | #80 | Exceptional 48.2% |
| Finns | 98.0 /100 | #81 | Exceptional 48.1% |
| Immigrants | Poland | 97.7 /100 | #82 | Exceptional 48.1% |
| Guamanians/Chamorros | 97.6 /100 | #83 | Exceptional 48.1% |
| Ukrainians | 97.6 /100 | #84 | Exceptional 48.1% |
| Immigrants | Israel | 97.4 /100 | #85 | Exceptional 48.0% |
| Belgians | 97.4 /100 | #86 | Exceptional 48.0% |
| Immigrants | Ireland | 97.3 /100 | #87 | Exceptional 48.0% |
| Afghans | 97.3 /100 | #88 | Exceptional 48.0% |
| Cypriots | 97.2 /100 | #89 | Exceptional 48.0% |
| French | 97.2 /100 | #90 | Exceptional 48.0% |
| Immigrants | Moldova | 97.0 /100 | #91 | Exceptional 48.0% |
| Palestinians | 96.9 /100 | #92 | Exceptional 48.0% |
| Lebanese | 96.9 /100 | #93 | Exceptional 47.9% |
| Americans | 96.9 /100 | #94 | Exceptional 47.9% |