Puget Sound Salish vs Aleut Married-couple Households
COMPARE
Puget Sound Salish
Aleut
Married-couple Households
Married-couple Households Comparison
Puget Sound Salish
Aleuts
47.4%
MARRIED-COUPLE HOUSEHOLDS
90.5/ 100
METRIC RATING
120th/ 347
METRIC RANK
45.6%
MARRIED-COUPLE HOUSEHOLDS
12.5/ 100
METRIC RATING
204th/ 347
METRIC RANK
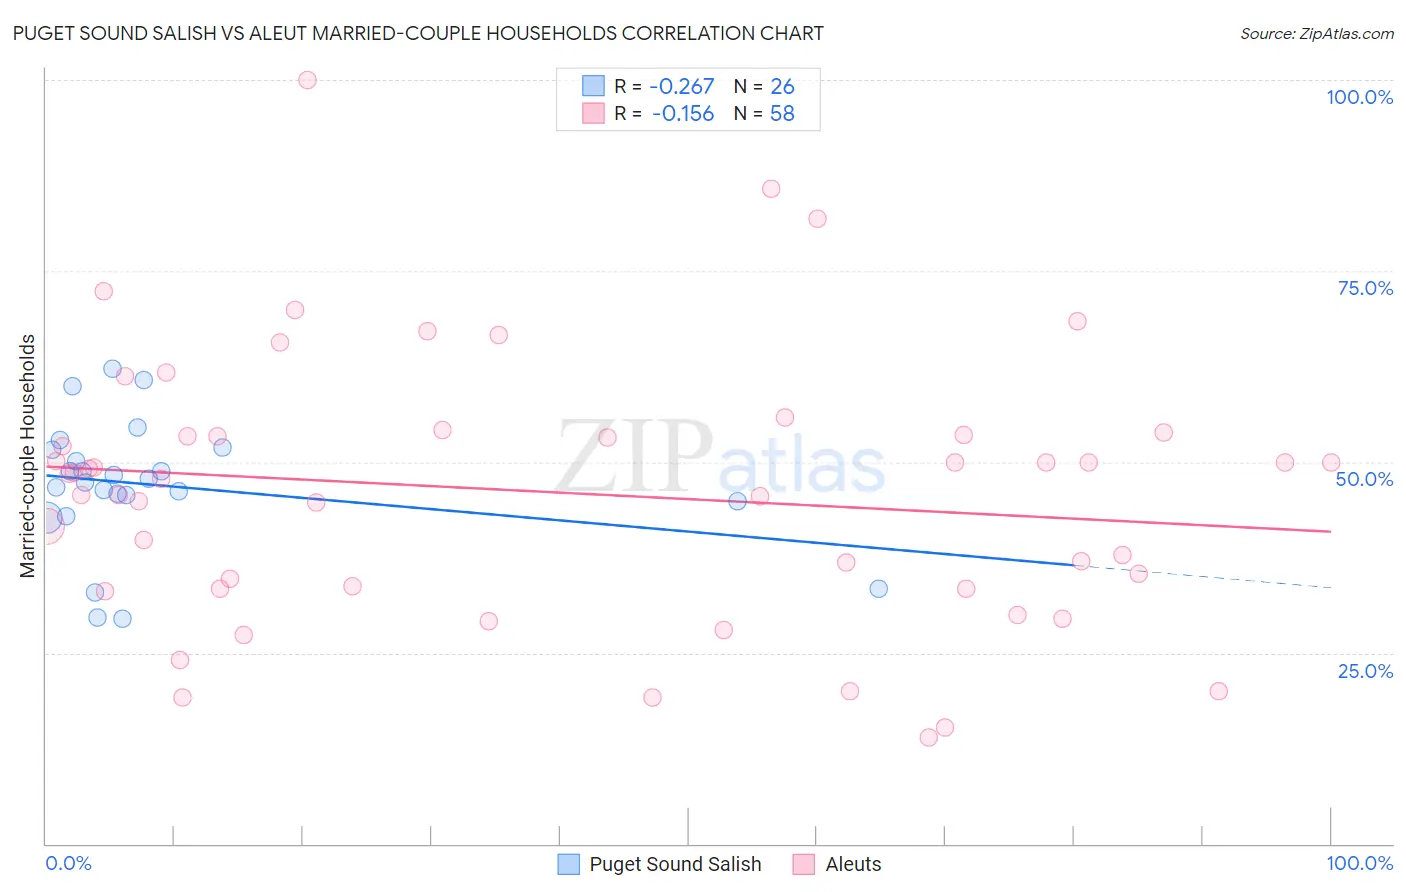
Puget Sound Salish vs Aleut Married-couple Households Correlation Chart
The statistical analysis conducted on geographies consisting of 46,155,865 people shows a weak negative correlation between the proportion of Puget Sound Salish and percentage of married-couple family households in the United States with a correlation coefficient (R) of -0.267 and weighted average of 47.4%. Similarly, the statistical analysis conducted on geographies consisting of 61,773,976 people shows a poor negative correlation between the proportion of Aleuts and percentage of married-couple family households in the United States with a correlation coefficient (R) of -0.156 and weighted average of 45.6%, a difference of 4.0%.
Married-couple Households Correlation Summary
| Measurement | Puget Sound Salish | Aleut |
| Minimum | 29.5% | 14.0% |
| Maximum | 62.2% | 100.0% |
| Range | 32.7% | 86.0% |
| Mean | 46.9% | 46.1% |
| Median | 47.6% | 48.2% |
| Interquartile 25% (IQ1) | 44.8% | 33.3% |
| Interquartile 75% (IQ3) | 51.6% | 53.6% |
| Interquartile Range (IQR) | 6.8% | 20.2% |
| Standard Deviation (Sample) | 8.4% | 17.7% |
| Standard Deviation (Population) | 8.3% | 17.5% |
Similar Demographics by Married-couple Households
Demographics Similar to Puget Sound Salish by Married-couple Households
In terms of married-couple households, the demographic groups most similar to Puget Sound Salish are Immigrants from Eastern Europe (47.4%, a difference of 0.020%), Okinawan (47.4%, a difference of 0.040%), Immigrants from Venezuela (47.4%, a difference of 0.13%), Zimbabwean (47.4%, a difference of 0.14%), and Australian (47.4%, a difference of 0.16%).
| Demographics | Rating | Rank | Married-couple Households |
| Venezuelans | 93.8 /100 | #113 | Exceptional 47.6% |
| Immigrants | Europe | 93.7 /100 | #114 | Exceptional 47.6% |
| Slovaks | 92.9 /100 | #115 | Exceptional 47.6% |
| Argentineans | 92.5 /100 | #116 | Exceptional 47.5% |
| French Canadians | 92.4 /100 | #117 | Exceptional 47.5% |
| Immigrants | Germany | 92.4 /100 | #118 | Exceptional 47.5% |
| Chileans | 92.2 /100 | #119 | Exceptional 47.5% |
| Puget Sound Salish | 90.5 /100 | #120 | Exceptional 47.4% |
| Immigrants | Eastern Europe | 90.3 /100 | #121 | Exceptional 47.4% |
| Okinawans | 90.1 /100 | #122 | Exceptional 47.4% |
| Immigrants | Venezuela | 89.3 /100 | #123 | Excellent 47.4% |
| Zimbabweans | 89.2 /100 | #124 | Excellent 47.4% |
| Australians | 89.0 /100 | #125 | Excellent 47.4% |
| Pakistanis | 88.6 /100 | #126 | Excellent 47.3% |
| Celtics | 88.1 /100 | #127 | Excellent 47.3% |
Demographics Similar to Aleuts by Married-couple Households
In terms of married-couple households, the demographic groups most similar to Aleuts are Alaska Native (45.6%, a difference of 0.050%), Nepalese (45.6%, a difference of 0.050%), Immigrants from Central America (45.7%, a difference of 0.14%), Uruguayan (45.5%, a difference of 0.20%), and Immigrants from Serbia (45.7%, a difference of 0.22%).
| Demographics | Rating | Rank | Married-couple Households |
| Cambodians | 21.3 /100 | #197 | Fair 45.9% |
| Ottawa | 19.4 /100 | #198 | Poor 45.8% |
| Carpatho Rusyns | 15.7 /100 | #199 | Poor 45.7% |
| Potawatomi | 15.6 /100 | #200 | Poor 45.7% |
| Immigrants | Serbia | 15.2 /100 | #201 | Poor 45.7% |
| Immigrants | Central America | 14.2 /100 | #202 | Poor 45.7% |
| Alaska Natives | 13.0 /100 | #203 | Poor 45.6% |
| Aleuts | 12.5 /100 | #204 | Poor 45.6% |
| Nepalese | 11.9 /100 | #205 | Poor 45.6% |
| Uruguayans | 10.4 /100 | #206 | Poor 45.5% |
| Immigrants | France | 8.8 /100 | #207 | Tragic 45.4% |
| Hispanics or Latinos | 8.7 /100 | #208 | Tragic 45.4% |
| Immigrants | Uzbekistan | 8.4 /100 | #209 | Tragic 45.4% |
| Cubans | 7.7 /100 | #210 | Tragic 45.4% |
| Immigrants | Spain | 7.3 /100 | #211 | Tragic 45.3% |