Puget Sound Salish vs Immigrants from Uganda Median Earnings
COMPARE
Puget Sound Salish
Immigrants from Uganda
Median Earnings
Median Earnings Comparison
Puget Sound Salish
Immigrants from Uganda
$46,333
MEDIAN EARNINGS
46.5/ 100
METRIC RATING
180th/ 347
METRIC RANK
$48,041
MEDIAN EARNINGS
90.5/ 100
METRIC RATING
133rd/ 347
METRIC RANK
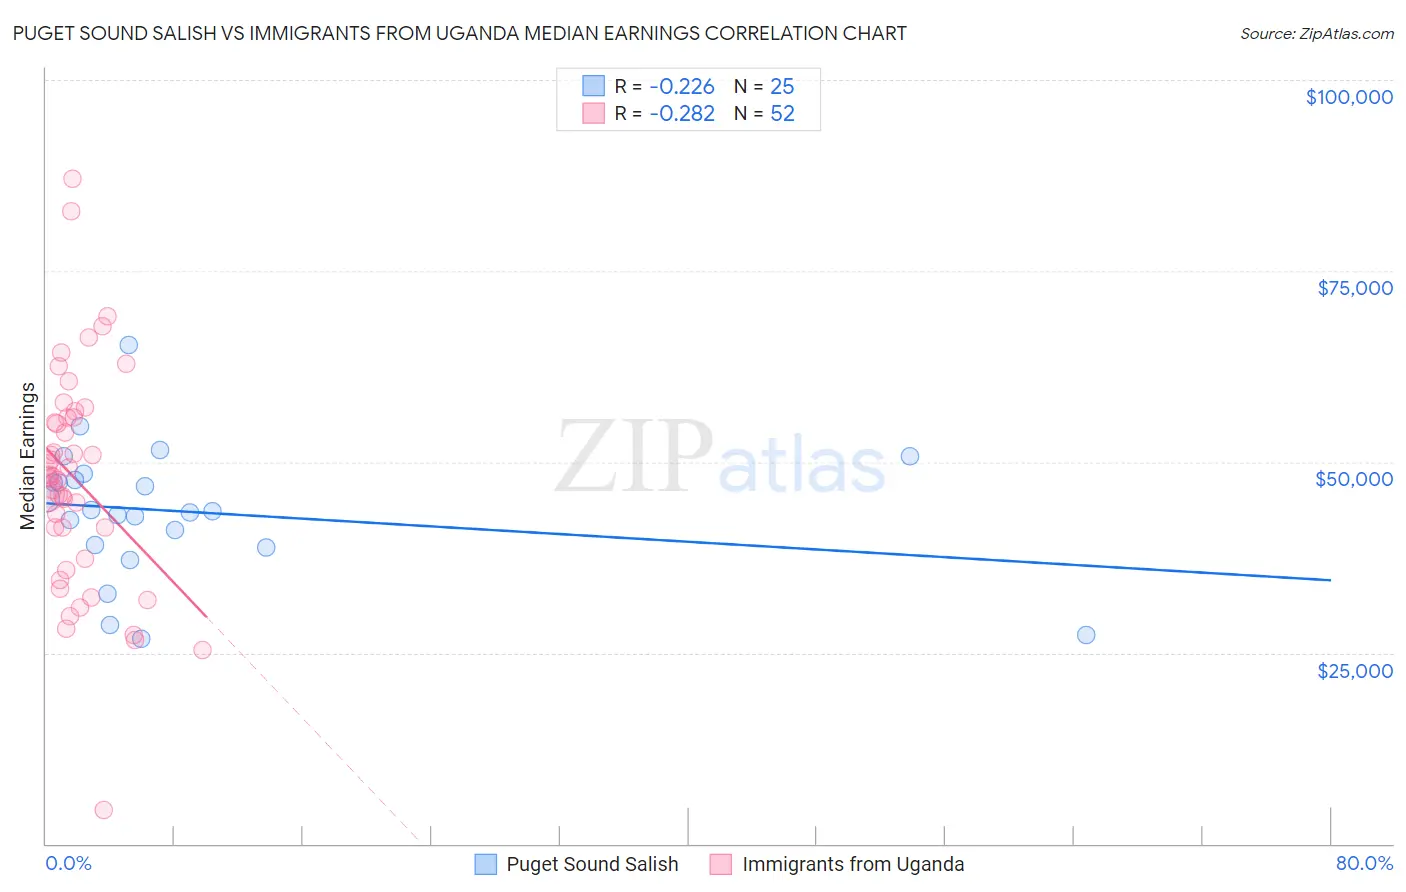
Puget Sound Salish vs Immigrants from Uganda Median Earnings Correlation Chart
The statistical analysis conducted on geographies consisting of 46,155,746 people shows a weak negative correlation between the proportion of Puget Sound Salish and median earnings in the United States with a correlation coefficient (R) of -0.226 and weighted average of $46,333. Similarly, the statistical analysis conducted on geographies consisting of 125,980,560 people shows a weak negative correlation between the proportion of Immigrants from Uganda and median earnings in the United States with a correlation coefficient (R) of -0.282 and weighted average of $48,041, a difference of 3.7%.
Median Earnings Correlation Summary
| Measurement | Puget Sound Salish | Immigrants from Uganda |
| Minimum | $26,875 | $4,426 |
| Maximum | $65,298 | $87,021 |
| Range | $38,423 | $82,595 |
| Mean | $43,450 | $47,722 |
| Median | $43,514 | $48,140 |
| Interquartile 25% (IQ1) | $38,912 | $39,326 |
| Interquartile 75% (IQ3) | $47,991 | $55,755 |
| Interquartile Range (IQR) | $9,079 | $16,429 |
| Standard Deviation (Sample) | $8,689 | $14,671 |
| Standard Deviation (Population) | $8,513 | $14,529 |
Similar Demographics by Median Earnings
Demographics Similar to Puget Sound Salish by Median Earnings
In terms of median earnings, the demographic groups most similar to Puget Sound Salish are English ($46,334, a difference of 0.0%), Immigrants from Cameroon ($46,329, a difference of 0.010%), Colombian ($46,349, a difference of 0.040%), Swiss ($46,315, a difference of 0.040%), and French ($46,296, a difference of 0.080%).
| Demographics | Rating | Rank | Median Earnings |
| Ghanaians | 50.3 /100 | #173 | Average $46,440 |
| Scandinavians | 50.0 /100 | #174 | Average $46,433 |
| Basques | 48.8 /100 | #175 | Average $46,399 |
| Danes | 48.6 /100 | #176 | Average $46,392 |
| Belgians | 48.0 /100 | #177 | Average $46,375 |
| Colombians | 47.1 /100 | #178 | Average $46,349 |
| English | 46.5 /100 | #179 | Average $46,334 |
| Puget Sound Salish | 46.5 /100 | #180 | Average $46,333 |
| Immigrants | Cameroon | 46.4 /100 | #181 | Average $46,329 |
| Swiss | 45.9 /100 | #182 | Average $46,315 |
| French | 45.2 /100 | #183 | Average $46,296 |
| Immigrants | Kenya | 42.4 /100 | #184 | Average $46,214 |
| Uruguayans | 41.6 /100 | #185 | Average $46,190 |
| Vietnamese | 40.9 /100 | #186 | Average $46,172 |
| Iraqis | 39.9 /100 | #187 | Fair $46,140 |
Demographics Similar to Immigrants from Uganda by Median Earnings
In terms of median earnings, the demographic groups most similar to Immigrants from Uganda are Sri Lankan ($48,040, a difference of 0.0%), Portuguese ($48,032, a difference of 0.020%), Slovene ($47,995, a difference of 0.10%), Immigrants from Nepal ($47,925, a difference of 0.24%), and European ($47,915, a difference of 0.26%).
| Demographics | Rating | Rank | Median Earnings |
| Assyrians/Chaldeans/Syriacs | 93.3 /100 | #126 | Exceptional $48,304 |
| Sierra Leoneans | 93.1 /100 | #127 | Exceptional $48,286 |
| Immigrants | Philippines | 92.9 /100 | #128 | Exceptional $48,266 |
| Pakistanis | 92.8 /100 | #129 | Exceptional $48,254 |
| Zimbabweans | 92.6 /100 | #130 | Exceptional $48,229 |
| Lebanese | 92.5 /100 | #131 | Exceptional $48,226 |
| British | 92.2 /100 | #132 | Exceptional $48,189 |
| Immigrants | Uganda | 90.5 /100 | #133 | Exceptional $48,041 |
| Sri Lankans | 90.5 /100 | #134 | Exceptional $48,040 |
| Portuguese | 90.4 /100 | #135 | Exceptional $48,032 |
| Slovenes | 90.0 /100 | #136 | Excellent $47,995 |
| Immigrants | Nepal | 89.0 /100 | #137 | Excellent $47,925 |
| Europeans | 88.9 /100 | #138 | Excellent $47,915 |
| Canadians | 88.8 /100 | #139 | Excellent $47,911 |
| Taiwanese | 88.7 /100 | #140 | Excellent $47,902 |