Puget Sound Salish vs Immigrants from Asia Married-couple Households
COMPARE
Puget Sound Salish
Immigrants from Asia
Married-couple Households
Married-couple Households Comparison
Puget Sound Salish
Immigrants from Asia
47.4%
MARRIED-COUPLE HOUSEHOLDS
90.5/ 100
METRIC RATING
120th/ 347
METRIC RANK
49.1%
MARRIED-COUPLE HOUSEHOLDS
99.7/ 100
METRIC RATING
33rd/ 347
METRIC RANK
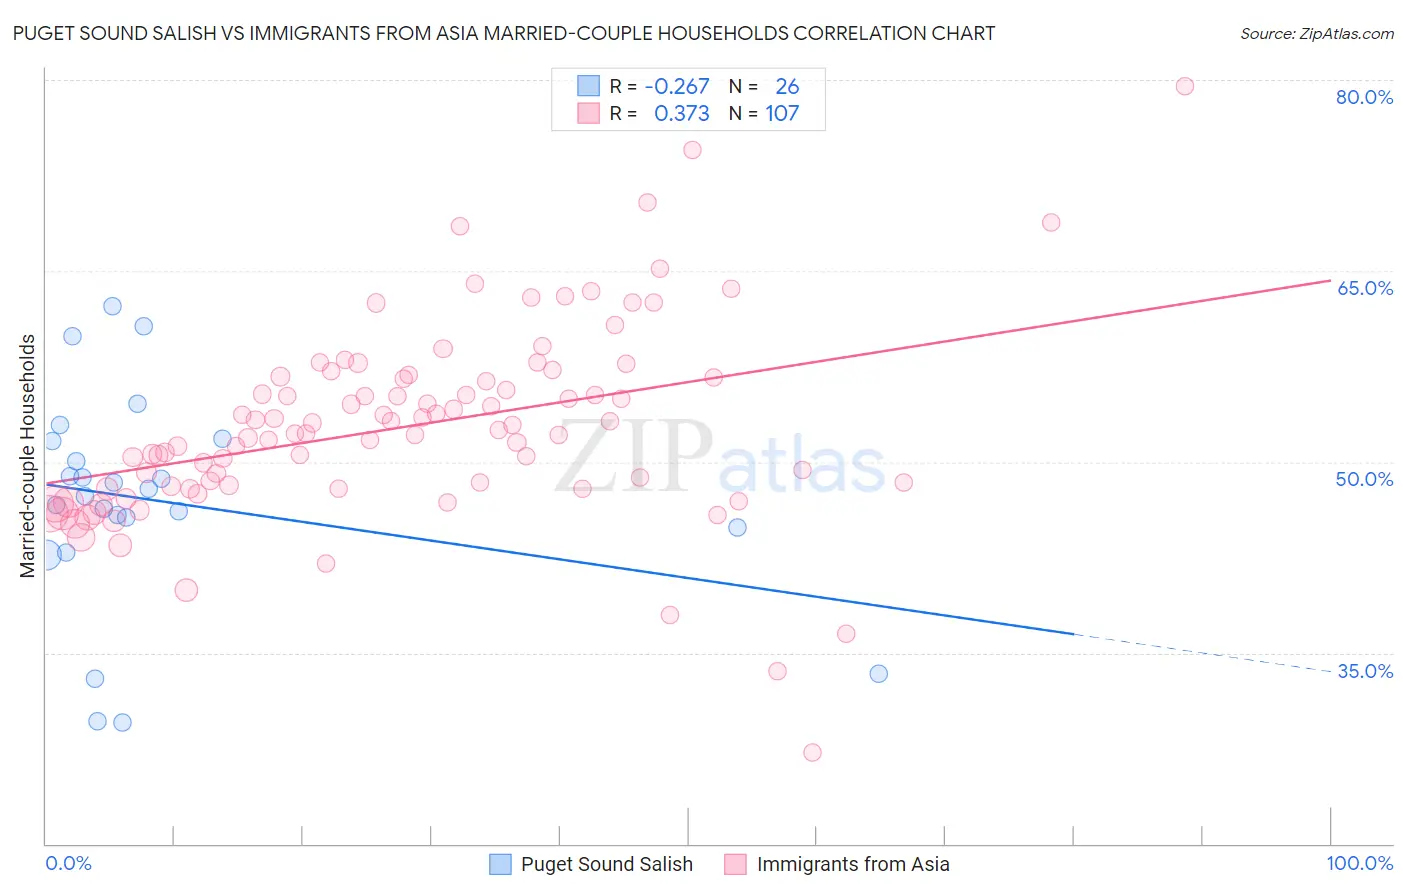
Puget Sound Salish vs Immigrants from Asia Married-couple Households Correlation Chart
The statistical analysis conducted on geographies consisting of 46,155,865 people shows a weak negative correlation between the proportion of Puget Sound Salish and percentage of married-couple family households in the United States with a correlation coefficient (R) of -0.267 and weighted average of 47.4%. Similarly, the statistical analysis conducted on geographies consisting of 548,508,948 people shows a mild positive correlation between the proportion of Immigrants from Asia and percentage of married-couple family households in the United States with a correlation coefficient (R) of 0.373 and weighted average of 49.1%, a difference of 3.4%.
Married-couple Households Correlation Summary
| Measurement | Puget Sound Salish | Immigrants from Asia |
| Minimum | 29.5% | 27.1% |
| Maximum | 62.2% | 79.5% |
| Range | 32.7% | 52.3% |
| Mean | 46.9% | 52.8% |
| Median | 47.6% | 52.2% |
| Interquartile 25% (IQ1) | 44.8% | 47.9% |
| Interquartile 75% (IQ3) | 51.6% | 56.6% |
| Interquartile Range (IQR) | 6.8% | 8.7% |
| Standard Deviation (Sample) | 8.4% | 7.7% |
| Standard Deviation (Population) | 8.3% | 7.7% |
Similar Demographics by Married-couple Households
Demographics Similar to Puget Sound Salish by Married-couple Households
In terms of married-couple households, the demographic groups most similar to Puget Sound Salish are Immigrants from Eastern Europe (47.4%, a difference of 0.020%), Okinawan (47.4%, a difference of 0.040%), Immigrants from Venezuela (47.4%, a difference of 0.13%), Zimbabwean (47.4%, a difference of 0.14%), and Australian (47.4%, a difference of 0.16%).
| Demographics | Rating | Rank | Married-couple Households |
| Venezuelans | 93.8 /100 | #113 | Exceptional 47.6% |
| Immigrants | Europe | 93.7 /100 | #114 | Exceptional 47.6% |
| Slovaks | 92.9 /100 | #115 | Exceptional 47.6% |
| Argentineans | 92.5 /100 | #116 | Exceptional 47.5% |
| French Canadians | 92.4 /100 | #117 | Exceptional 47.5% |
| Immigrants | Germany | 92.4 /100 | #118 | Exceptional 47.5% |
| Chileans | 92.2 /100 | #119 | Exceptional 47.5% |
| Puget Sound Salish | 90.5 /100 | #120 | Exceptional 47.4% |
| Immigrants | Eastern Europe | 90.3 /100 | #121 | Exceptional 47.4% |
| Okinawans | 90.1 /100 | #122 | Exceptional 47.4% |
| Immigrants | Venezuela | 89.3 /100 | #123 | Excellent 47.4% |
| Zimbabweans | 89.2 /100 | #124 | Excellent 47.4% |
| Australians | 89.0 /100 | #125 | Excellent 47.4% |
| Pakistanis | 88.6 /100 | #126 | Excellent 47.3% |
| Celtics | 88.1 /100 | #127 | Excellent 47.3% |
Demographics Similar to Immigrants from Asia by Married-couple Households
In terms of married-couple households, the demographic groups most similar to Immigrants from Asia are Hungarian (49.1%, a difference of 0.030%), Italian (49.0%, a difference of 0.080%), Native Hawaiian (49.1%, a difference of 0.090%), Scottish (49.0%, a difference of 0.10%), and Iranian (49.0%, a difference of 0.19%).
| Demographics | Rating | Rank | Married-couple Households |
| Immigrants | Scotland | 99.8 /100 | #26 | Exceptional 49.3% |
| Bhutanese | 99.8 /100 | #27 | Exceptional 49.3% |
| Germans | 99.8 /100 | #28 | Exceptional 49.2% |
| Maltese | 99.8 /100 | #29 | Exceptional 49.2% |
| Bolivians | 99.8 /100 | #30 | Exceptional 49.2% |
| Native Hawaiians | 99.8 /100 | #31 | Exceptional 49.1% |
| Hungarians | 99.8 /100 | #32 | Exceptional 49.1% |
| Immigrants | Asia | 99.7 /100 | #33 | Exceptional 49.1% |
| Italians | 99.7 /100 | #34 | Exceptional 49.0% |
| Scottish | 99.7 /100 | #35 | Exceptional 49.0% |
| Iranians | 99.7 /100 | #36 | Exceptional 49.0% |
| Sri Lankans | 99.7 /100 | #37 | Exceptional 49.0% |
| Greeks | 99.7 /100 | #38 | Exceptional 48.9% |
| Lithuanians | 99.6 /100 | #39 | Exceptional 48.9% |
| Immigrants | Bolivia | 99.6 /100 | #40 | Exceptional 48.9% |