Puget Sound Salish vs West Indian Married-couple Households
COMPARE
Puget Sound Salish
West Indian
Married-couple Households
Married-couple Households Comparison
Puget Sound Salish
West Indians
47.4%
MARRIED-COUPLE HOUSEHOLDS
90.5/ 100
METRIC RATING
120th/ 347
METRIC RANK
40.3%
MARRIED-COUPLE HOUSEHOLDS
0.0/ 100
METRIC RATING
320th/ 347
METRIC RANK
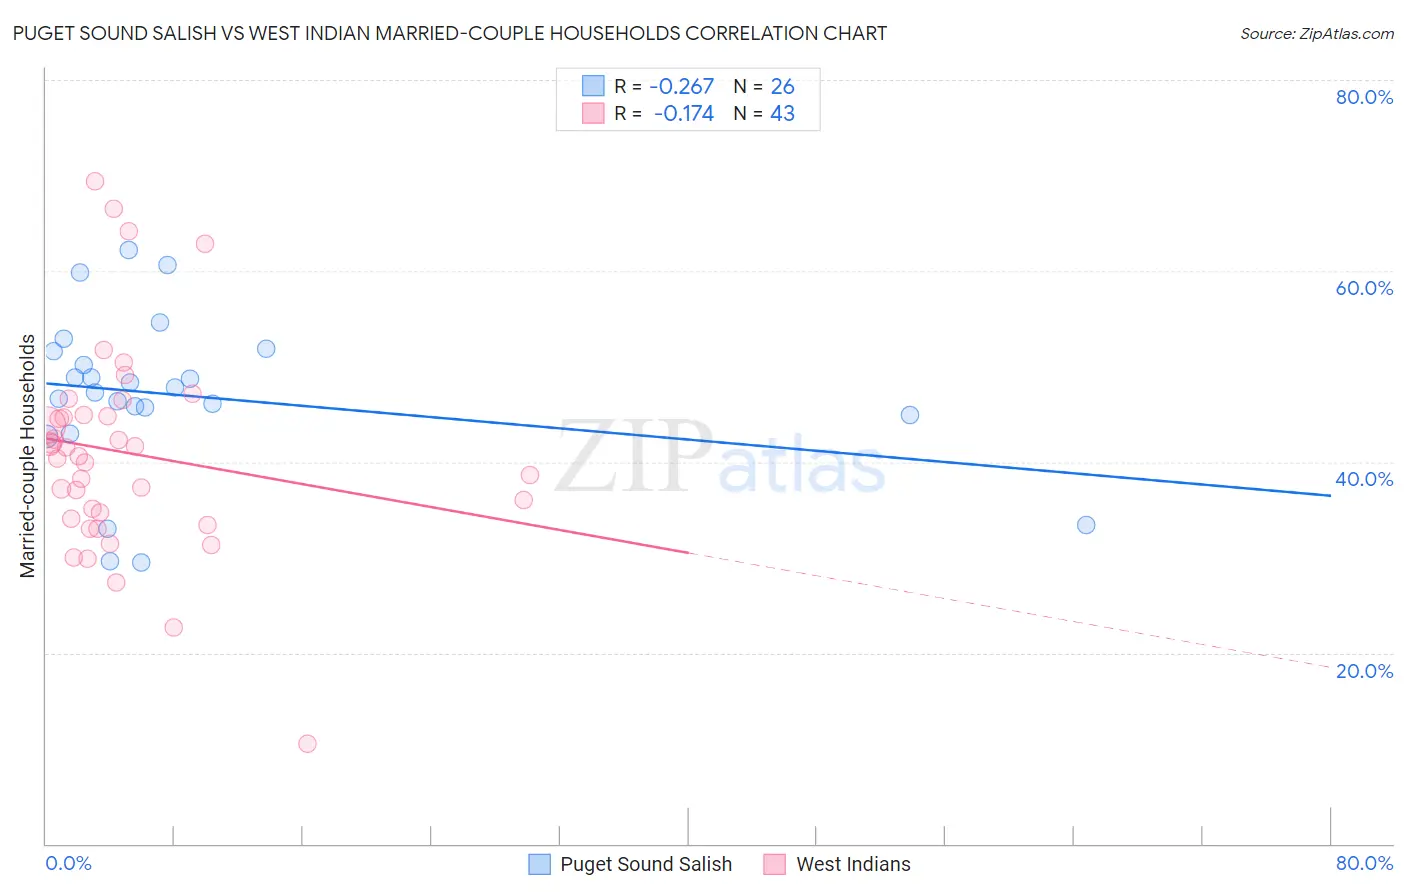
Puget Sound Salish vs West Indian Married-couple Households Correlation Chart
The statistical analysis conducted on geographies consisting of 46,155,865 people shows a weak negative correlation between the proportion of Puget Sound Salish and percentage of married-couple family households in the United States with a correlation coefficient (R) of -0.267 and weighted average of 47.4%. Similarly, the statistical analysis conducted on geographies consisting of 253,854,054 people shows a poor negative correlation between the proportion of West Indians and percentage of married-couple family households in the United States with a correlation coefficient (R) of -0.174 and weighted average of 40.3%, a difference of 17.6%.
Married-couple Households Correlation Summary
| Measurement | Puget Sound Salish | West Indian |
| Minimum | 29.5% | 10.5% |
| Maximum | 62.2% | 69.4% |
| Range | 32.7% | 58.9% |
| Mean | 46.9% | 40.9% |
| Median | 47.6% | 40.5% |
| Interquartile 25% (IQ1) | 44.8% | 34.0% |
| Interquartile 75% (IQ3) | 51.6% | 44.9% |
| Interquartile Range (IQR) | 6.8% | 10.8% |
| Standard Deviation (Sample) | 8.4% | 11.1% |
| Standard Deviation (Population) | 8.3% | 11.0% |
Similar Demographics by Married-couple Households
Demographics Similar to Puget Sound Salish by Married-couple Households
In terms of married-couple households, the demographic groups most similar to Puget Sound Salish are Immigrants from Eastern Europe (47.4%, a difference of 0.020%), Okinawan (47.4%, a difference of 0.040%), Immigrants from Venezuela (47.4%, a difference of 0.13%), Zimbabwean (47.4%, a difference of 0.14%), and Australian (47.4%, a difference of 0.16%).
| Demographics | Rating | Rank | Married-couple Households |
| Venezuelans | 93.8 /100 | #113 | Exceptional 47.6% |
| Immigrants | Europe | 93.7 /100 | #114 | Exceptional 47.6% |
| Slovaks | 92.9 /100 | #115 | Exceptional 47.6% |
| Argentineans | 92.5 /100 | #116 | Exceptional 47.5% |
| French Canadians | 92.4 /100 | #117 | Exceptional 47.5% |
| Immigrants | Germany | 92.4 /100 | #118 | Exceptional 47.5% |
| Chileans | 92.2 /100 | #119 | Exceptional 47.5% |
| Puget Sound Salish | 90.5 /100 | #120 | Exceptional 47.4% |
| Immigrants | Eastern Europe | 90.3 /100 | #121 | Exceptional 47.4% |
| Okinawans | 90.1 /100 | #122 | Exceptional 47.4% |
| Immigrants | Venezuela | 89.3 /100 | #123 | Excellent 47.4% |
| Zimbabweans | 89.2 /100 | #124 | Excellent 47.4% |
| Australians | 89.0 /100 | #125 | Excellent 47.4% |
| Pakistanis | 88.6 /100 | #126 | Excellent 47.3% |
| Celtics | 88.1 /100 | #127 | Excellent 47.3% |
Demographics Similar to West Indians by Married-couple Households
In terms of married-couple households, the demographic groups most similar to West Indians are Immigrants from Liberia (40.3%, a difference of 0.040%), Bahamian (40.5%, a difference of 0.42%), Immigrants from Zaire (40.1%, a difference of 0.70%), Puerto Rican (40.1%, a difference of 0.70%), and Navajo (40.1%, a difference of 0.71%).
| Demographics | Rating | Rank | Married-couple Households |
| Immigrants | Haiti | 0.0 /100 | #313 | Tragic 40.9% |
| Jamaicans | 0.0 /100 | #314 | Tragic 40.9% |
| Trinidadians and Tobagonians | 0.0 /100 | #315 | Tragic 40.9% |
| Immigrants | Caribbean | 0.0 /100 | #316 | Tragic 40.8% |
| Immigrants | Jamaica | 0.0 /100 | #317 | Tragic 40.7% |
| Liberians | 0.0 /100 | #318 | Tragic 40.7% |
| Bahamians | 0.0 /100 | #319 | Tragic 40.5% |
| West Indians | 0.0 /100 | #320 | Tragic 40.3% |
| Immigrants | Liberia | 0.0 /100 | #321 | Tragic 40.3% |
| Immigrants | Zaire | 0.0 /100 | #322 | Tragic 40.1% |
| Puerto Ricans | 0.0 /100 | #323 | Tragic 40.1% |
| Navajo | 0.0 /100 | #324 | Tragic 40.1% |
| Pueblo | 0.0 /100 | #325 | Tragic 40.0% |
| U.S. Virgin Islanders | 0.0 /100 | #326 | Tragic 39.8% |
| Lumbee | 0.0 /100 | #327 | Tragic 39.6% |