Polish vs Immigrants from Poland Single Mother Households
COMPARE
Polish
Immigrants from Poland
Single Mother Households
Single Mother Households Comparison
Poles
Immigrants from Poland
5.6%
SINGLE MOTHER HOUSEHOLDS
98.6/ 100
METRIC RATING
62nd/ 347
METRIC RANK
5.8%
SINGLE MOTHER HOUSEHOLDS
96.3/ 100
METRIC RATING
99th/ 347
METRIC RANK
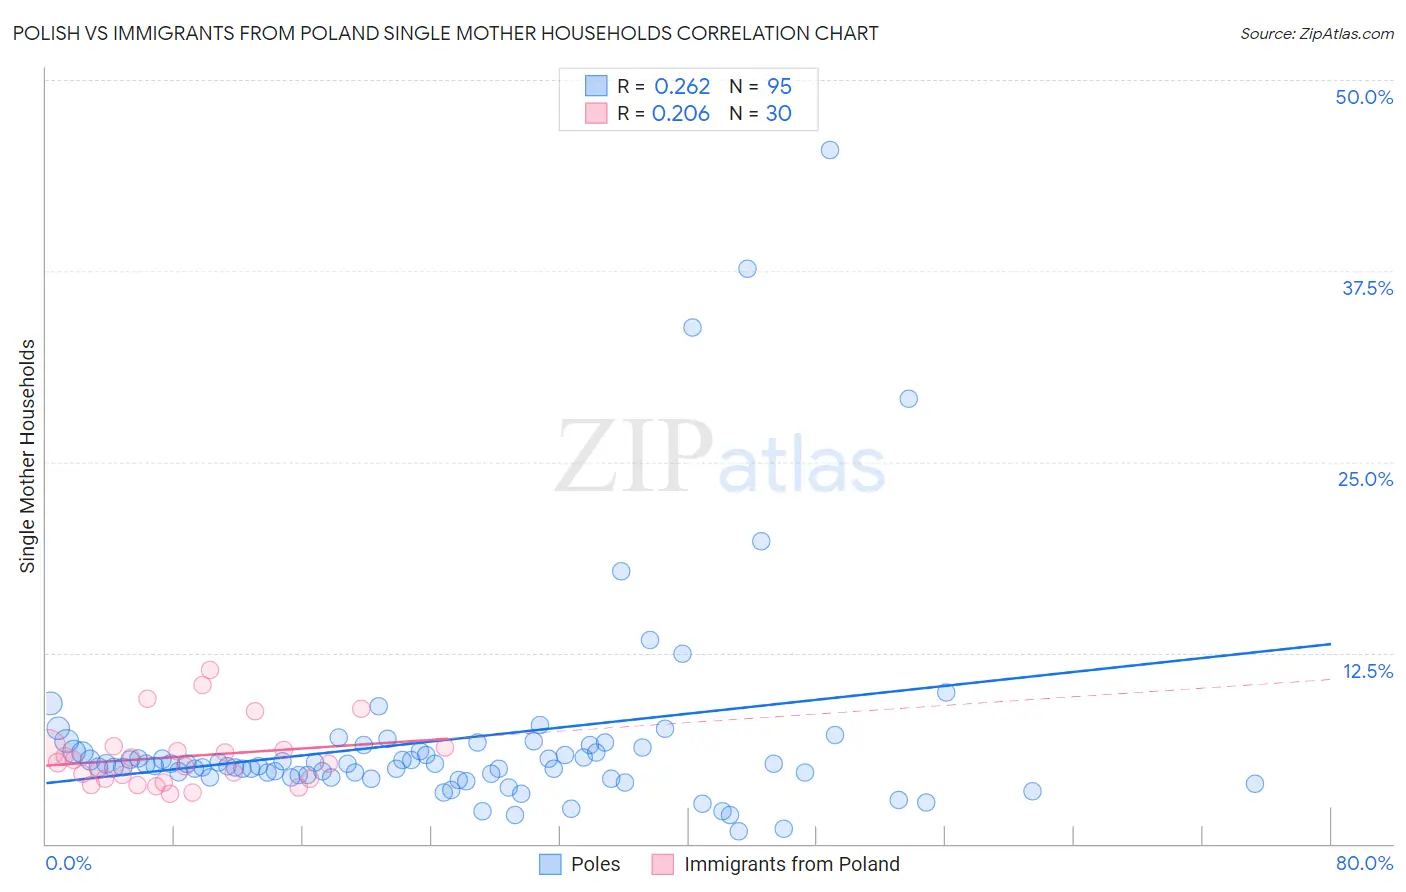
Polish vs Immigrants from Poland Single Mother Households Correlation Chart
The statistical analysis conducted on geographies consisting of 555,545,245 people shows a weak positive correlation between the proportion of Poles and percentage of single mother households in the United States with a correlation coefficient (R) of 0.262 and weighted average of 5.6%. Similarly, the statistical analysis conducted on geographies consisting of 304,111,620 people shows a weak positive correlation between the proportion of Immigrants from Poland and percentage of single mother households in the United States with a correlation coefficient (R) of 0.206 and weighted average of 5.8%, a difference of 3.2%.
Single Mother Households Correlation Summary
| Measurement | Polish | Immigrants from Poland |
| Minimum | 0.85% | 3.3% |
| Maximum | 45.5% | 11.4% |
| Range | 44.6% | 8.1% |
| Mean | 6.8% | 5.7% |
| Median | 5.2% | 5.3% |
| Interquartile 25% (IQ1) | 4.4% | 4.2% |
| Interquartile 75% (IQ3) | 6.3% | 6.3% |
| Interquartile Range (IQR) | 1.9% | 2.1% |
| Standard Deviation (Sample) | 7.0% | 2.1% |
| Standard Deviation (Population) | 6.9% | 2.1% |
Similar Demographics by Single Mother Households
Demographics Similar to Poles by Single Mother Households
In terms of single mother households, the demographic groups most similar to Poles are Australian (5.6%, a difference of 0.010%), Immigrants from North Macedonia (5.6%, a difference of 0.070%), Immigrants from Norway (5.6%, a difference of 0.080%), Immigrants from France (5.6%, a difference of 0.10%), and Greek (5.6%, a difference of 0.15%).
| Demographics | Rating | Rank | Single Mother Households |
| Immigrants | Denmark | 99.1 /100 | #55 | Exceptional 5.5% |
| Immigrants | Romania | 99.0 /100 | #56 | Exceptional 5.5% |
| Immigrants | Europe | 99.0 /100 | #57 | Exceptional 5.5% |
| Danes | 98.9 /100 | #58 | Exceptional 5.5% |
| Luxembourgers | 98.7 /100 | #59 | Exceptional 5.6% |
| Immigrants | Norway | 98.7 /100 | #60 | Exceptional 5.6% |
| Australians | 98.7 /100 | #61 | Exceptional 5.6% |
| Poles | 98.6 /100 | #62 | Exceptional 5.6% |
| Immigrants | North Macedonia | 98.6 /100 | #63 | Exceptional 5.6% |
| Immigrants | France | 98.6 /100 | #64 | Exceptional 5.6% |
| Greeks | 98.6 /100 | #65 | Exceptional 5.6% |
| Immigrants | Canada | 98.5 /100 | #66 | Exceptional 5.6% |
| Italians | 98.5 /100 | #67 | Exceptional 5.6% |
| Immigrants | Bulgaria | 98.5 /100 | #68 | Exceptional 5.6% |
| Asians | 98.5 /100 | #69 | Exceptional 5.6% |
Demographics Similar to Immigrants from Poland by Single Mother Households
In terms of single mother households, the demographic groups most similar to Immigrants from Poland are Scandinavian (5.8%, a difference of 0.010%), German (5.8%, a difference of 0.040%), Immigrants from South Africa (5.7%, a difference of 0.050%), English (5.8%, a difference of 0.050%), and Scottish (5.8%, a difference of 0.070%).
| Demographics | Rating | Rank | Single Mother Households |
| Immigrants | Western Asia | 96.7 /100 | #92 | Exceptional 5.7% |
| Serbians | 96.7 /100 | #93 | Exceptional 5.7% |
| Basques | 96.7 /100 | #94 | Exceptional 5.7% |
| Slovaks | 96.6 /100 | #95 | Exceptional 5.7% |
| Austrians | 96.4 /100 | #96 | Exceptional 5.7% |
| Tlingit-Haida | 96.4 /100 | #97 | Exceptional 5.7% |
| Immigrants | South Africa | 96.3 /100 | #98 | Exceptional 5.7% |
| Immigrants | Poland | 96.3 /100 | #99 | Exceptional 5.8% |
| Scandinavians | 96.2 /100 | #100 | Exceptional 5.8% |
| Germans | 96.2 /100 | #101 | Exceptional 5.8% |
| English | 96.2 /100 | #102 | Exceptional 5.8% |
| Scottish | 96.2 /100 | #103 | Exceptional 5.8% |
| Northern Europeans | 96.2 /100 | #104 | Exceptional 5.8% |
| Taiwanese | 96.1 /100 | #105 | Exceptional 5.8% |
| Immigrants | Ukraine | 95.9 /100 | #106 | Exceptional 5.8% |