Polish vs Immigrants from South America Single Mother Households
COMPARE
Polish
Immigrants from South America
Single Mother Households
Single Mother Households Comparison
Poles
Immigrants from South America
5.6%
SINGLE MOTHER HOUSEHOLDS
98.6/ 100
METRIC RATING
62nd/ 347
METRIC RANK
6.7%
SINGLE MOTHER HOUSEHOLDS
11.5/ 100
METRIC RATING
207th/ 347
METRIC RANK
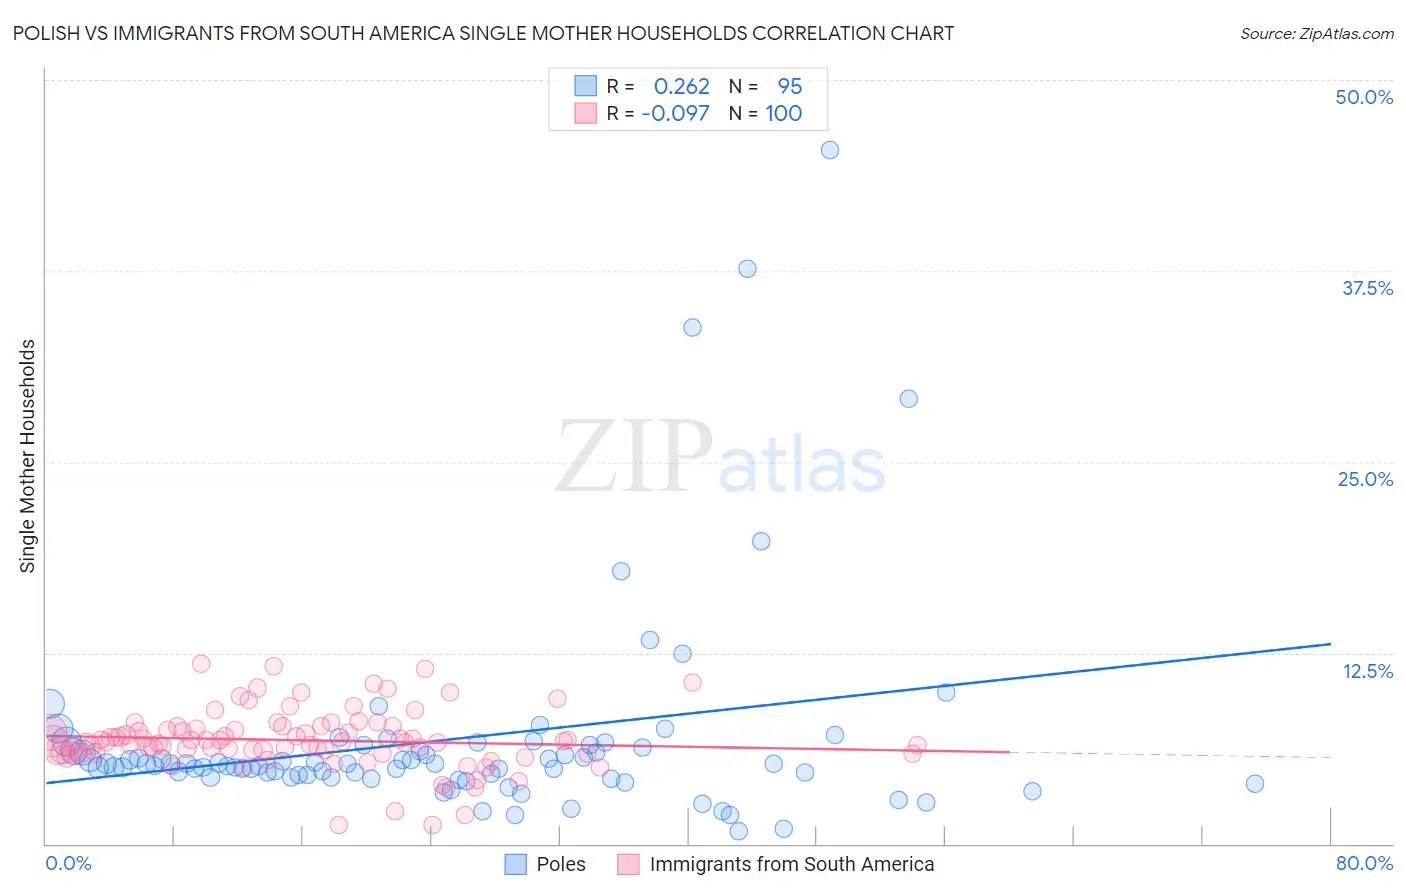
Polish vs Immigrants from South America Single Mother Households Correlation Chart
The statistical analysis conducted on geographies consisting of 555,545,245 people shows a weak positive correlation between the proportion of Poles and percentage of single mother households in the United States with a correlation coefficient (R) of 0.262 and weighted average of 5.6%. Similarly, the statistical analysis conducted on geographies consisting of 484,293,400 people shows a slight negative correlation between the proportion of Immigrants from South America and percentage of single mother households in the United States with a correlation coefficient (R) of -0.097 and weighted average of 6.7%, a difference of 19.6%.
Single Mother Households Correlation Summary
| Measurement | Polish | Immigrants from South America |
| Minimum | 0.85% | 1.2% |
| Maximum | 45.5% | 11.8% |
| Range | 44.6% | 10.6% |
| Mean | 6.8% | 6.8% |
| Median | 5.2% | 6.7% |
| Interquartile 25% (IQ1) | 4.4% | 6.0% |
| Interquartile 75% (IQ3) | 6.3% | 7.6% |
| Interquartile Range (IQR) | 1.9% | 1.6% |
| Standard Deviation (Sample) | 7.0% | 2.0% |
| Standard Deviation (Population) | 6.9% | 1.9% |
Similar Demographics by Single Mother Households
Demographics Similar to Poles by Single Mother Households
In terms of single mother households, the demographic groups most similar to Poles are Australian (5.6%, a difference of 0.010%), Immigrants from North Macedonia (5.6%, a difference of 0.070%), Immigrants from Norway (5.6%, a difference of 0.080%), Immigrants from France (5.6%, a difference of 0.10%), and Greek (5.6%, a difference of 0.15%).
| Demographics | Rating | Rank | Single Mother Households |
| Immigrants | Denmark | 99.1 /100 | #55 | Exceptional 5.5% |
| Immigrants | Romania | 99.0 /100 | #56 | Exceptional 5.5% |
| Immigrants | Europe | 99.0 /100 | #57 | Exceptional 5.5% |
| Danes | 98.9 /100 | #58 | Exceptional 5.5% |
| Luxembourgers | 98.7 /100 | #59 | Exceptional 5.6% |
| Immigrants | Norway | 98.7 /100 | #60 | Exceptional 5.6% |
| Australians | 98.7 /100 | #61 | Exceptional 5.6% |
| Poles | 98.6 /100 | #62 | Exceptional 5.6% |
| Immigrants | North Macedonia | 98.6 /100 | #63 | Exceptional 5.6% |
| Immigrants | France | 98.6 /100 | #64 | Exceptional 5.6% |
| Greeks | 98.6 /100 | #65 | Exceptional 5.6% |
| Immigrants | Canada | 98.5 /100 | #66 | Exceptional 5.6% |
| Italians | 98.5 /100 | #67 | Exceptional 5.6% |
| Immigrants | Bulgaria | 98.5 /100 | #68 | Exceptional 5.6% |
| Asians | 98.5 /100 | #69 | Exceptional 5.6% |
Demographics Similar to Immigrants from South America by Single Mother Households
In terms of single mother households, the demographic groups most similar to Immigrants from South America are German Russian (6.7%, a difference of 0.0%), Vietnamese (6.7%, a difference of 0.050%), Cree (6.7%, a difference of 0.080%), Immigrants from Fiji (6.7%, a difference of 0.10%), and Immigrants from Peru (6.7%, a difference of 0.11%).
| Demographics | Rating | Rank | Single Mother Households |
| Immigrants | Ethiopia | 14.7 /100 | #200 | Poor 6.6% |
| Venezuelans | 12.9 /100 | #201 | Poor 6.6% |
| Guamanians/Chamorros | 12.4 /100 | #202 | Poor 6.6% |
| Immigrants | Peru | 12.0 /100 | #203 | Poor 6.7% |
| Immigrants | Fiji | 11.9 /100 | #204 | Poor 6.7% |
| Cree | 11.9 /100 | #205 | Poor 6.7% |
| German Russians | 11.5 /100 | #206 | Poor 6.7% |
| Immigrants | South America | 11.5 /100 | #207 | Poor 6.7% |
| Vietnamese | 11.3 /100 | #208 | Poor 6.7% |
| Immigrants | Colombia | 10.5 /100 | #209 | Poor 6.7% |
| Immigrants | Nonimmigrants | 10.4 /100 | #210 | Poor 6.7% |
| Immigrants | Venezuela | 8.5 /100 | #211 | Tragic 6.7% |
| Immigrants | Eritrea | 8.4 /100 | #212 | Tragic 6.7% |
| Immigrants | Costa Rica | 8.2 /100 | #213 | Tragic 6.7% |
| Immigrants | Uruguay | 7.9 /100 | #214 | Tragic 6.7% |