Polish vs Immigrants from Ethiopia Single Mother Households
COMPARE
Polish
Immigrants from Ethiopia
Single Mother Households
Single Mother Households Comparison
Poles
Immigrants from Ethiopia
5.6%
SINGLE MOTHER HOUSEHOLDS
98.6/ 100
METRIC RATING
62nd/ 347
METRIC RANK
6.6%
SINGLE MOTHER HOUSEHOLDS
14.7/ 100
METRIC RATING
200th/ 347
METRIC RANK
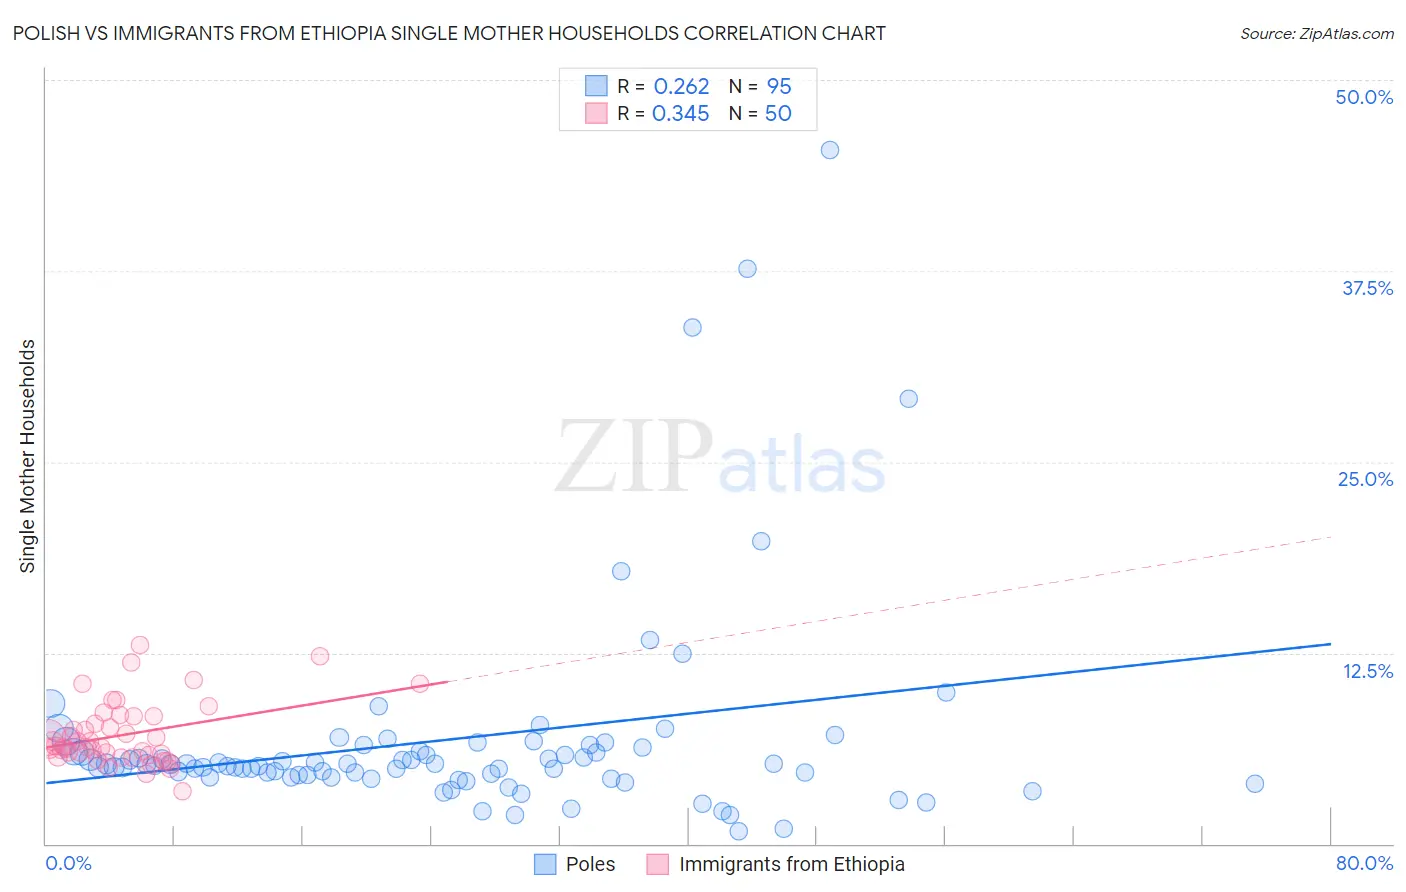
Polish vs Immigrants from Ethiopia Single Mother Households Correlation Chart
The statistical analysis conducted on geographies consisting of 555,545,245 people shows a weak positive correlation between the proportion of Poles and percentage of single mother households in the United States with a correlation coefficient (R) of 0.262 and weighted average of 5.6%. Similarly, the statistical analysis conducted on geographies consisting of 211,335,389 people shows a mild positive correlation between the proportion of Immigrants from Ethiopia and percentage of single mother households in the United States with a correlation coefficient (R) of 0.345 and weighted average of 6.6%, a difference of 18.7%.
Single Mother Households Correlation Summary
| Measurement | Polish | Immigrants from Ethiopia |
| Minimum | 0.85% | 3.4% |
| Maximum | 45.5% | 13.0% |
| Range | 44.6% | 9.6% |
| Mean | 6.8% | 7.1% |
| Median | 5.2% | 6.4% |
| Interquartile 25% (IQ1) | 4.4% | 5.8% |
| Interquartile 75% (IQ3) | 6.3% | 8.3% |
| Interquartile Range (IQR) | 1.9% | 2.5% |
| Standard Deviation (Sample) | 7.0% | 2.1% |
| Standard Deviation (Population) | 6.9% | 2.0% |
Similar Demographics by Single Mother Households
Demographics Similar to Poles by Single Mother Households
In terms of single mother households, the demographic groups most similar to Poles are Australian (5.6%, a difference of 0.010%), Immigrants from North Macedonia (5.6%, a difference of 0.070%), Immigrants from Norway (5.6%, a difference of 0.080%), Immigrants from France (5.6%, a difference of 0.10%), and Greek (5.6%, a difference of 0.15%).
| Demographics | Rating | Rank | Single Mother Households |
| Immigrants | Denmark | 99.1 /100 | #55 | Exceptional 5.5% |
| Immigrants | Romania | 99.0 /100 | #56 | Exceptional 5.5% |
| Immigrants | Europe | 99.0 /100 | #57 | Exceptional 5.5% |
| Danes | 98.9 /100 | #58 | Exceptional 5.5% |
| Luxembourgers | 98.7 /100 | #59 | Exceptional 5.6% |
| Immigrants | Norway | 98.7 /100 | #60 | Exceptional 5.6% |
| Australians | 98.7 /100 | #61 | Exceptional 5.6% |
| Poles | 98.6 /100 | #62 | Exceptional 5.6% |
| Immigrants | North Macedonia | 98.6 /100 | #63 | Exceptional 5.6% |
| Immigrants | France | 98.6 /100 | #64 | Exceptional 5.6% |
| Greeks | 98.6 /100 | #65 | Exceptional 5.6% |
| Immigrants | Canada | 98.5 /100 | #66 | Exceptional 5.6% |
| Italians | 98.5 /100 | #67 | Exceptional 5.6% |
| Immigrants | Bulgaria | 98.5 /100 | #68 | Exceptional 5.6% |
| Asians | 98.5 /100 | #69 | Exceptional 5.6% |
Demographics Similar to Immigrants from Ethiopia by Single Mother Households
In terms of single mother households, the demographic groups most similar to Immigrants from Ethiopia are Potawatomi (6.6%, a difference of 0.16%), Hawaiian (6.6%, a difference of 0.27%), Venezuelan (6.6%, a difference of 0.40%), Guamanian/Chamorro (6.6%, a difference of 0.52%), and Moroccan (6.6%, a difference of 0.53%).
| Demographics | Rating | Rank | Single Mother Households |
| Colombians | 18.3 /100 | #193 | Poor 6.6% |
| Immigrants | Uganda | 18.3 /100 | #194 | Poor 6.6% |
| South Americans | 18.0 /100 | #195 | Poor 6.6% |
| Uruguayans | 18.0 /100 | #196 | Poor 6.6% |
| Moroccans | 17.4 /100 | #197 | Poor 6.6% |
| Hawaiians | 16.1 /100 | #198 | Poor 6.6% |
| Potawatomi | 15.5 /100 | #199 | Poor 6.6% |
| Immigrants | Ethiopia | 14.7 /100 | #200 | Poor 6.6% |
| Venezuelans | 12.9 /100 | #201 | Poor 6.6% |
| Guamanians/Chamorros | 12.4 /100 | #202 | Poor 6.6% |
| Immigrants | Peru | 12.0 /100 | #203 | Poor 6.7% |
| Immigrants | Fiji | 11.9 /100 | #204 | Poor 6.7% |
| Cree | 11.9 /100 | #205 | Poor 6.7% |
| German Russians | 11.5 /100 | #206 | Poor 6.7% |
| Immigrants | South America | 11.5 /100 | #207 | Poor 6.7% |