Welsh vs Immigrants from Poland Single Mother Households
COMPARE
Welsh
Immigrants from Poland
Single Mother Households
Single Mother Households Comparison
Welsh
Immigrants from Poland
5.9%
SINGLE MOTHER HOUSEHOLDS
92.8/ 100
METRIC RATING
126th/ 347
METRIC RANK
5.8%
SINGLE MOTHER HOUSEHOLDS
96.3/ 100
METRIC RATING
99th/ 347
METRIC RANK
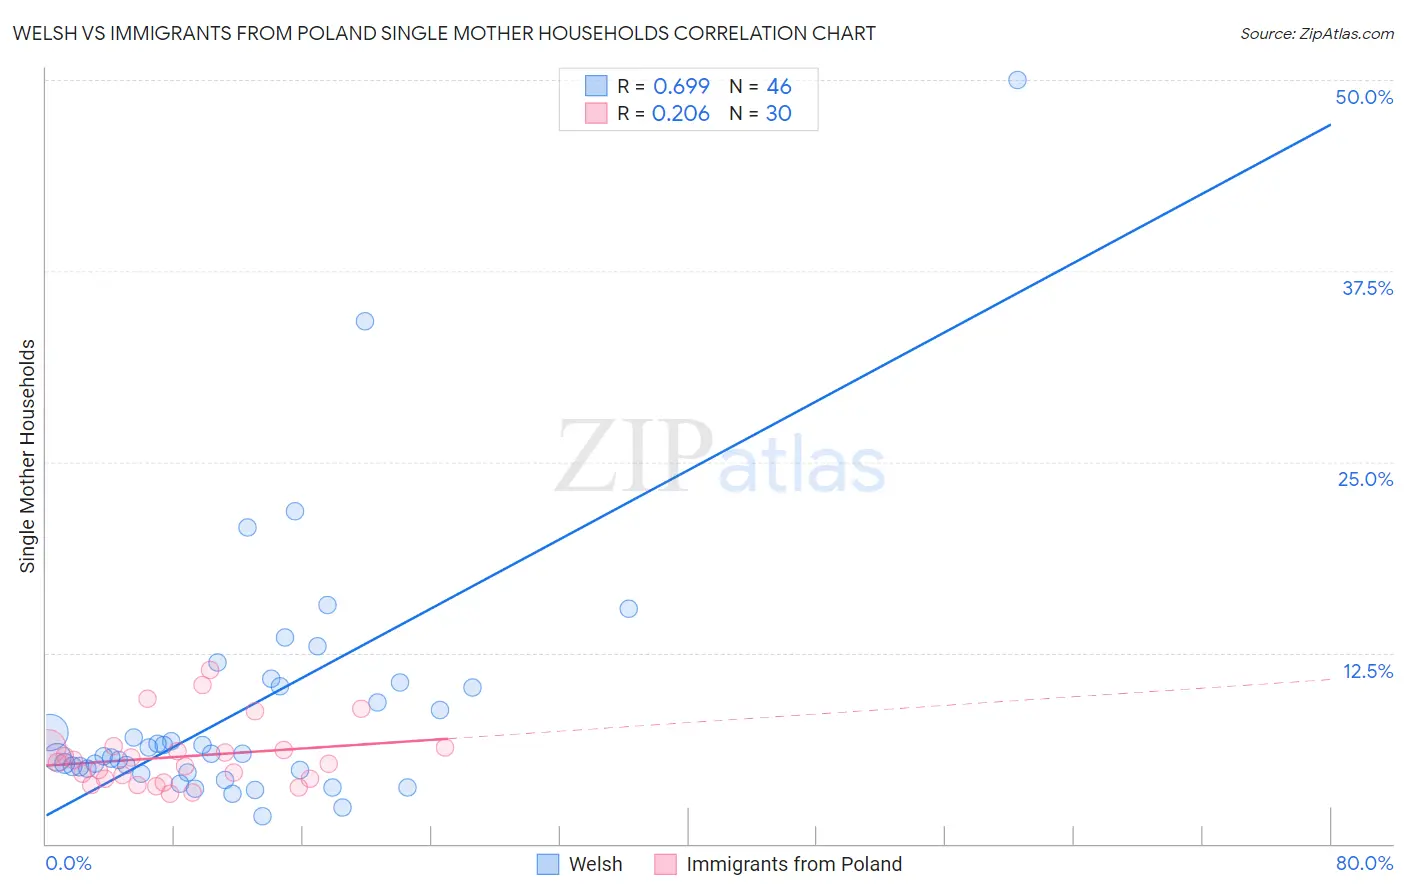
Welsh vs Immigrants from Poland Single Mother Households Correlation Chart
The statistical analysis conducted on geographies consisting of 524,967,910 people shows a significant positive correlation between the proportion of Welsh and percentage of single mother households in the United States with a correlation coefficient (R) of 0.699 and weighted average of 5.9%. Similarly, the statistical analysis conducted on geographies consisting of 304,111,620 people shows a weak positive correlation between the proportion of Immigrants from Poland and percentage of single mother households in the United States with a correlation coefficient (R) of 0.206 and weighted average of 5.8%, a difference of 2.1%.
Single Mother Households Correlation Summary
| Measurement | Welsh | Immigrants from Poland |
| Minimum | 1.8% | 3.3% |
| Maximum | 50.0% | 11.4% |
| Range | 48.2% | 8.1% |
| Mean | 9.0% | 5.7% |
| Median | 5.9% | 5.3% |
| Interquartile 25% (IQ1) | 4.8% | 4.2% |
| Interquartile 75% (IQ3) | 10.3% | 6.3% |
| Interquartile Range (IQR) | 5.5% | 2.1% |
| Standard Deviation (Sample) | 8.6% | 2.1% |
| Standard Deviation (Population) | 8.5% | 2.1% |
Similar Demographics by Single Mother Households
Demographics Similar to Welsh by Single Mother Households
In terms of single mother households, the demographic groups most similar to Welsh are Slavic (5.9%, a difference of 0.020%), Immigrants from Argentina (5.9%, a difference of 0.18%), Lebanese (5.9%, a difference of 0.19%), Immigrants from Uzbekistan (5.9%, a difference of 0.25%), and Czechoslovakian (5.9%, a difference of 0.27%).
| Demographics | Rating | Rank | Single Mother Households |
| South Africans | 94.1 /100 | #119 | Exceptional 5.8% |
| Tongans | 93.7 /100 | #120 | Exceptional 5.8% |
| Argentineans | 93.7 /100 | #121 | Exceptional 5.8% |
| Belgians | 93.5 /100 | #122 | Exceptional 5.8% |
| Immigrants | Uzbekistan | 93.4 /100 | #123 | Exceptional 5.9% |
| Immigrants | Argentina | 93.2 /100 | #124 | Exceptional 5.9% |
| Slavs | 92.9 /100 | #125 | Exceptional 5.9% |
| Welsh | 92.8 /100 | #126 | Exceptional 5.9% |
| Lebanese | 92.4 /100 | #127 | Exceptional 5.9% |
| Czechoslovakians | 92.2 /100 | #128 | Exceptional 5.9% |
| Immigrants | Bolivia | 92.2 /100 | #129 | Exceptional 5.9% |
| Palestinians | 92.1 /100 | #130 | Exceptional 5.9% |
| Immigrants | Spain | 91.2 /100 | #131 | Exceptional 5.9% |
| Albanians | 91.1 /100 | #132 | Exceptional 5.9% |
| Egyptians | 90.7 /100 | #133 | Exceptional 5.9% |
Demographics Similar to Immigrants from Poland by Single Mother Households
In terms of single mother households, the demographic groups most similar to Immigrants from Poland are Scandinavian (5.8%, a difference of 0.010%), German (5.8%, a difference of 0.040%), Immigrants from South Africa (5.7%, a difference of 0.050%), English (5.8%, a difference of 0.050%), and Scottish (5.8%, a difference of 0.070%).
| Demographics | Rating | Rank | Single Mother Households |
| Immigrants | Western Asia | 96.7 /100 | #92 | Exceptional 5.7% |
| Serbians | 96.7 /100 | #93 | Exceptional 5.7% |
| Basques | 96.7 /100 | #94 | Exceptional 5.7% |
| Slovaks | 96.6 /100 | #95 | Exceptional 5.7% |
| Austrians | 96.4 /100 | #96 | Exceptional 5.7% |
| Tlingit-Haida | 96.4 /100 | #97 | Exceptional 5.7% |
| Immigrants | South Africa | 96.3 /100 | #98 | Exceptional 5.7% |
| Immigrants | Poland | 96.3 /100 | #99 | Exceptional 5.8% |
| Scandinavians | 96.2 /100 | #100 | Exceptional 5.8% |
| Germans | 96.2 /100 | #101 | Exceptional 5.8% |
| English | 96.2 /100 | #102 | Exceptional 5.8% |
| Scottish | 96.2 /100 | #103 | Exceptional 5.8% |
| Northern Europeans | 96.2 /100 | #104 | Exceptional 5.8% |
| Taiwanese | 96.1 /100 | #105 | Exceptional 5.8% |
| Immigrants | Ukraine | 95.9 /100 | #106 | Exceptional 5.8% |