Polish vs Immigrants from Guatemala Single Mother Households
COMPARE
Polish
Immigrants from Guatemala
Single Mother Households
Single Mother Households Comparison
Poles
Immigrants from Guatemala
5.6%
SINGLE MOTHER HOUSEHOLDS
98.6/ 100
METRIC RATING
62nd/ 347
METRIC RANK
7.7%
SINGLE MOTHER HOUSEHOLDS
0.0/ 100
METRIC RATING
287th/ 347
METRIC RANK
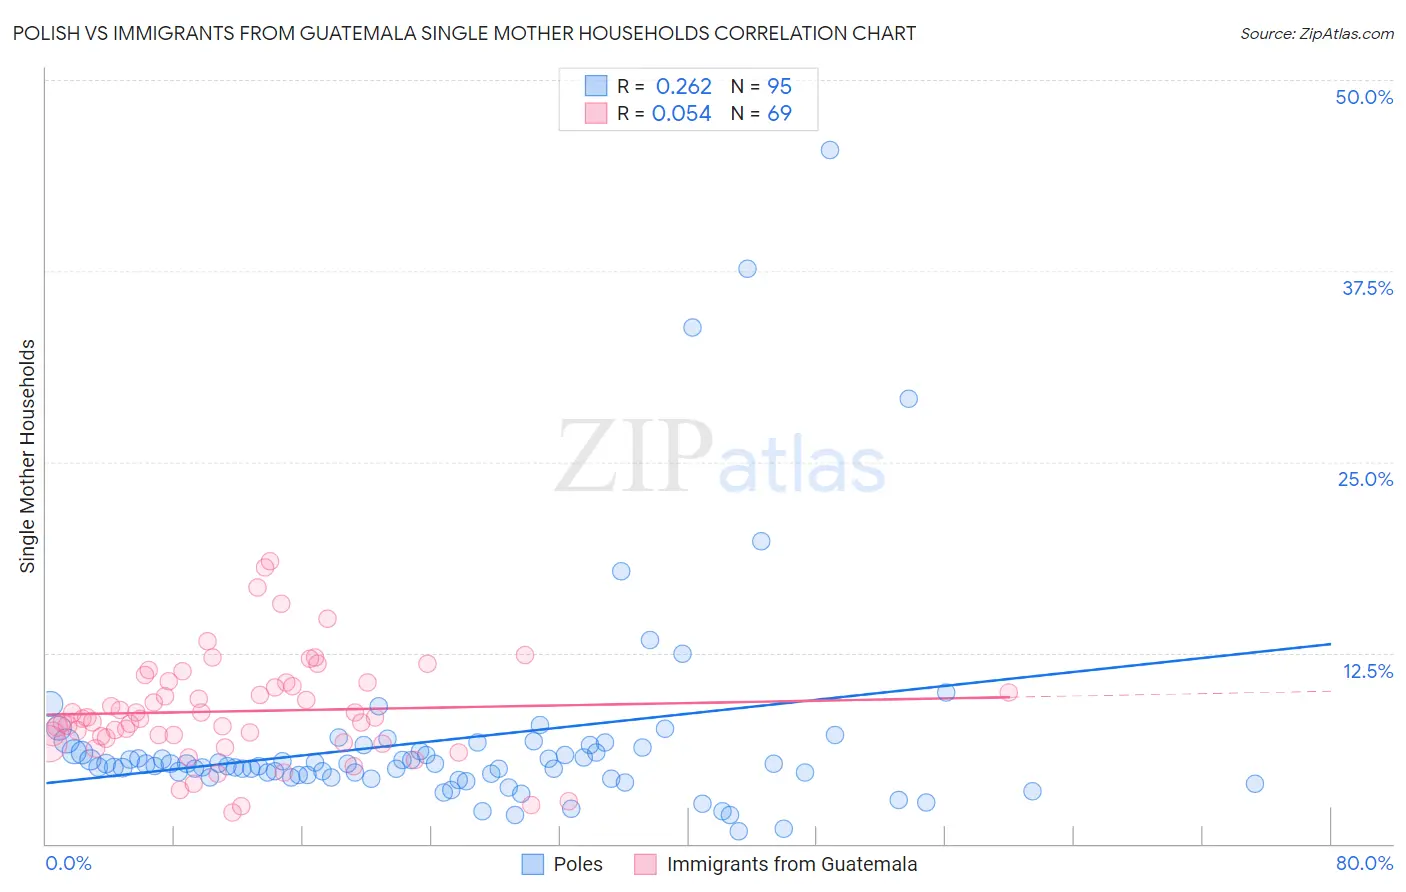
Polish vs Immigrants from Guatemala Single Mother Households Correlation Chart
The statistical analysis conducted on geographies consisting of 555,545,245 people shows a weak positive correlation between the proportion of Poles and percentage of single mother households in the United States with a correlation coefficient (R) of 0.262 and weighted average of 5.6%. Similarly, the statistical analysis conducted on geographies consisting of 376,787,729 people shows a slight positive correlation between the proportion of Immigrants from Guatemala and percentage of single mother households in the United States with a correlation coefficient (R) of 0.054 and weighted average of 7.7%, a difference of 38.8%.
Single Mother Households Correlation Summary
| Measurement | Polish | Immigrants from Guatemala |
| Minimum | 0.85% | 2.0% |
| Maximum | 45.5% | 18.5% |
| Range | 44.6% | 16.5% |
| Mean | 6.8% | 8.7% |
| Median | 5.2% | 8.2% |
| Interquartile 25% (IQ1) | 4.4% | 6.8% |
| Interquartile 75% (IQ3) | 6.3% | 10.5% |
| Interquartile Range (IQR) | 1.9% | 3.7% |
| Standard Deviation (Sample) | 7.0% | 3.4% |
| Standard Deviation (Population) | 6.9% | 3.4% |
Similar Demographics by Single Mother Households
Demographics Similar to Poles by Single Mother Households
In terms of single mother households, the demographic groups most similar to Poles are Australian (5.6%, a difference of 0.010%), Immigrants from North Macedonia (5.6%, a difference of 0.070%), Immigrants from Norway (5.6%, a difference of 0.080%), Immigrants from France (5.6%, a difference of 0.10%), and Greek (5.6%, a difference of 0.15%).
| Demographics | Rating | Rank | Single Mother Households |
| Immigrants | Denmark | 99.1 /100 | #55 | Exceptional 5.5% |
| Immigrants | Romania | 99.0 /100 | #56 | Exceptional 5.5% |
| Immigrants | Europe | 99.0 /100 | #57 | Exceptional 5.5% |
| Danes | 98.9 /100 | #58 | Exceptional 5.5% |
| Luxembourgers | 98.7 /100 | #59 | Exceptional 5.6% |
| Immigrants | Norway | 98.7 /100 | #60 | Exceptional 5.6% |
| Australians | 98.7 /100 | #61 | Exceptional 5.6% |
| Poles | 98.6 /100 | #62 | Exceptional 5.6% |
| Immigrants | North Macedonia | 98.6 /100 | #63 | Exceptional 5.6% |
| Immigrants | France | 98.6 /100 | #64 | Exceptional 5.6% |
| Greeks | 98.6 /100 | #65 | Exceptional 5.6% |
| Immigrants | Canada | 98.5 /100 | #66 | Exceptional 5.6% |
| Italians | 98.5 /100 | #67 | Exceptional 5.6% |
| Immigrants | Bulgaria | 98.5 /100 | #68 | Exceptional 5.6% |
| Asians | 98.5 /100 | #69 | Exceptional 5.6% |
Demographics Similar to Immigrants from Guatemala by Single Mother Households
In terms of single mother households, the demographic groups most similar to Immigrants from Guatemala are Sierra Leonean (7.7%, a difference of 0.050%), Immigrants from Middle Africa (7.7%, a difference of 0.10%), Trinidadian and Tobagonian (7.7%, a difference of 0.21%), Immigrants from Belize (7.7%, a difference of 0.24%), and Nigerian (7.7%, a difference of 0.84%).
| Demographics | Rating | Rank | Single Mother Households |
| Immigrants | Sierra Leone | 0.0 /100 | #280 | Tragic 7.7% |
| Immigrants | Laos | 0.0 /100 | #281 | Tragic 7.7% |
| Guatemalans | 0.0 /100 | #282 | Tragic 7.7% |
| Nigerians | 0.0 /100 | #283 | Tragic 7.7% |
| Immigrants | Belize | 0.0 /100 | #284 | Tragic 7.7% |
| Trinidadians and Tobagonians | 0.0 /100 | #285 | Tragic 7.7% |
| Immigrants | Middle Africa | 0.0 /100 | #286 | Tragic 7.7% |
| Immigrants | Guatemala | 0.0 /100 | #287 | Tragic 7.7% |
| Sierra Leoneans | 0.0 /100 | #288 | Tragic 7.7% |
| Sub-Saharan Africans | 0.0 /100 | #289 | Tragic 7.8% |
| Immigrants | Nigeria | 0.0 /100 | #290 | Tragic 7.8% |
| West Indians | 0.0 /100 | #291 | Tragic 7.8% |
| Ghanaians | 0.0 /100 | #292 | Tragic 7.8% |
| Immigrants | Cameroon | 0.0 /100 | #293 | Tragic 7.9% |
| Apache | 0.0 /100 | #294 | Tragic 7.9% |