Polish vs Immigrants from Kuwait Single Mother Households
COMPARE
Polish
Immigrants from Kuwait
Single Mother Households
Single Mother Households Comparison
Poles
Immigrants from Kuwait
5.6%
SINGLE MOTHER HOUSEHOLDS
98.6/ 100
METRIC RATING
62nd/ 347
METRIC RANK
5.8%
SINGLE MOTHER HOUSEHOLDS
95.4/ 100
METRIC RATING
112th/ 347
METRIC RANK
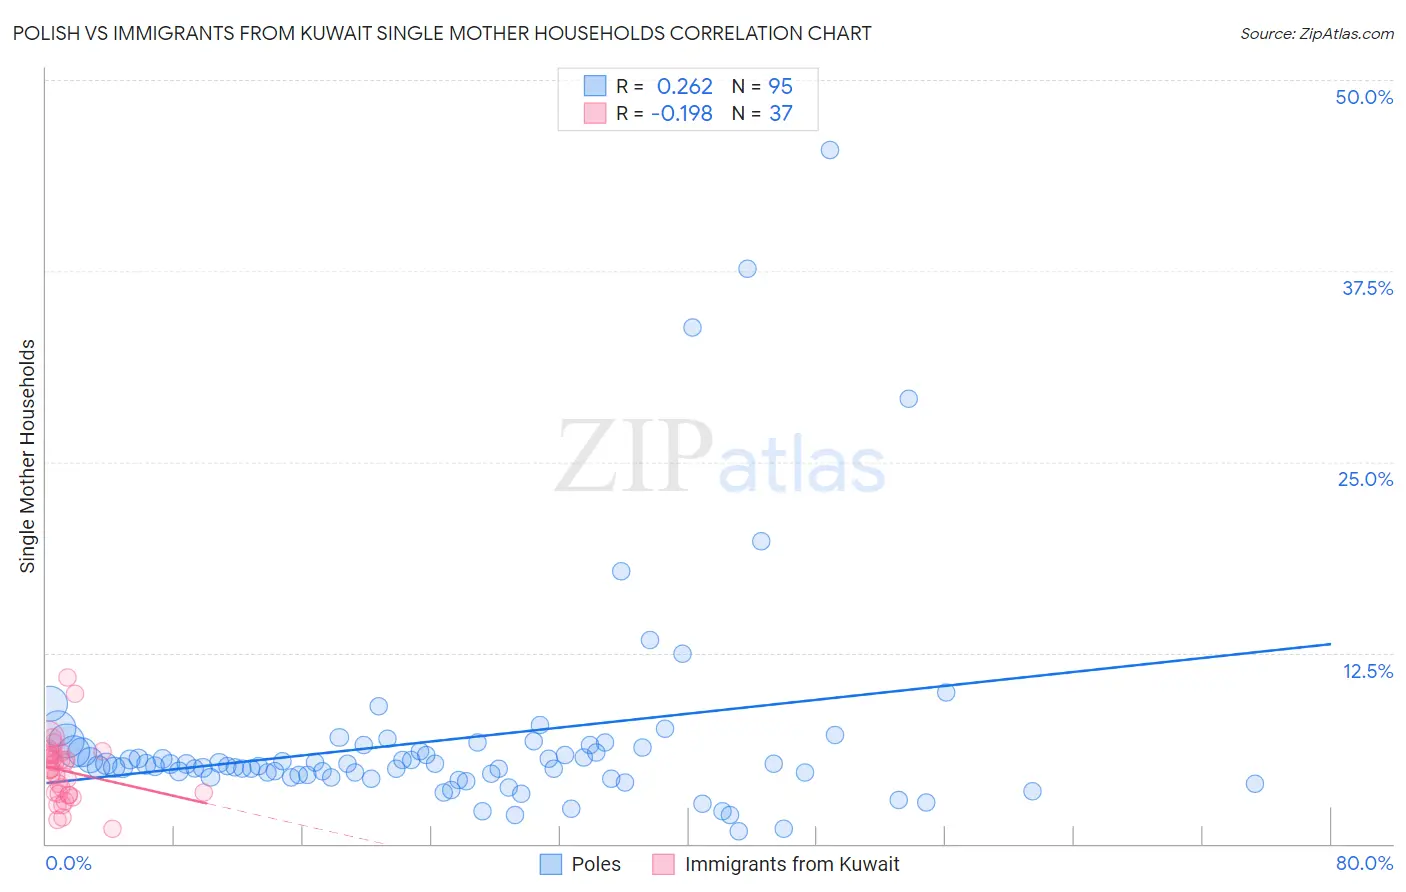
Polish vs Immigrants from Kuwait Single Mother Households Correlation Chart
The statistical analysis conducted on geographies consisting of 555,545,245 people shows a weak positive correlation between the proportion of Poles and percentage of single mother households in the United States with a correlation coefficient (R) of 0.262 and weighted average of 5.6%. Similarly, the statistical analysis conducted on geographies consisting of 136,852,016 people shows a poor negative correlation between the proportion of Immigrants from Kuwait and percentage of single mother households in the United States with a correlation coefficient (R) of -0.198 and weighted average of 5.8%, a difference of 3.9%.
Single Mother Households Correlation Summary
| Measurement | Polish | Immigrants from Kuwait |
| Minimum | 0.85% | 0.94% |
| Maximum | 45.5% | 10.9% |
| Range | 44.6% | 10.0% |
| Mean | 6.8% | 4.8% |
| Median | 5.2% | 4.9% |
| Interquartile 25% (IQ1) | 4.4% | 3.2% |
| Interquartile 75% (IQ3) | 6.3% | 5.9% |
| Interquartile Range (IQR) | 1.9% | 2.6% |
| Standard Deviation (Sample) | 7.0% | 2.1% |
| Standard Deviation (Population) | 6.9% | 2.0% |
Similar Demographics by Single Mother Households
Demographics Similar to Poles by Single Mother Households
In terms of single mother households, the demographic groups most similar to Poles are Australian (5.6%, a difference of 0.010%), Immigrants from North Macedonia (5.6%, a difference of 0.070%), Immigrants from Norway (5.6%, a difference of 0.080%), Immigrants from France (5.6%, a difference of 0.10%), and Greek (5.6%, a difference of 0.15%).
| Demographics | Rating | Rank | Single Mother Households |
| Immigrants | Denmark | 99.1 /100 | #55 | Exceptional 5.5% |
| Immigrants | Romania | 99.0 /100 | #56 | Exceptional 5.5% |
| Immigrants | Europe | 99.0 /100 | #57 | Exceptional 5.5% |
| Danes | 98.9 /100 | #58 | Exceptional 5.5% |
| Luxembourgers | 98.7 /100 | #59 | Exceptional 5.6% |
| Immigrants | Norway | 98.7 /100 | #60 | Exceptional 5.6% |
| Australians | 98.7 /100 | #61 | Exceptional 5.6% |
| Poles | 98.6 /100 | #62 | Exceptional 5.6% |
| Immigrants | North Macedonia | 98.6 /100 | #63 | Exceptional 5.6% |
| Immigrants | France | 98.6 /100 | #64 | Exceptional 5.6% |
| Greeks | 98.6 /100 | #65 | Exceptional 5.6% |
| Immigrants | Canada | 98.5 /100 | #66 | Exceptional 5.6% |
| Italians | 98.5 /100 | #67 | Exceptional 5.6% |
| Immigrants | Bulgaria | 98.5 /100 | #68 | Exceptional 5.6% |
| Asians | 98.5 /100 | #69 | Exceptional 5.6% |
Demographics Similar to Immigrants from Kuwait by Single Mother Households
In terms of single mother households, the demographic groups most similar to Immigrants from Kuwait are Immigrants from England (5.8%, a difference of 0.040%), British (5.8%, a difference of 0.070%), Mongolian (5.8%, a difference of 0.070%), Immigrants from Western Europe (5.8%, a difference of 0.16%), and Dutch (5.8%, a difference of 0.20%).
| Demographics | Rating | Rank | Single Mother Households |
| Taiwanese | 96.1 /100 | #105 | Exceptional 5.8% |
| Immigrants | Ukraine | 95.9 /100 | #106 | Exceptional 5.8% |
| Paraguayans | 95.8 /100 | #107 | Exceptional 5.8% |
| Immigrants | Italy | 95.8 /100 | #108 | Exceptional 5.8% |
| Immigrants | Western Europe | 95.7 /100 | #109 | Exceptional 5.8% |
| British | 95.5 /100 | #110 | Exceptional 5.8% |
| Immigrants | England | 95.5 /100 | #111 | Exceptional 5.8% |
| Immigrants | Kuwait | 95.4 /100 | #112 | Exceptional 5.8% |
| Mongolians | 95.3 /100 | #113 | Exceptional 5.8% |
| Dutch | 95.1 /100 | #114 | Exceptional 5.8% |
| Irish | 94.8 /100 | #115 | Exceptional 5.8% |
| Pennsylvania Germans | 94.7 /100 | #116 | Exceptional 5.8% |
| Bolivians | 94.6 /100 | #117 | Exceptional 5.8% |
| Laotians | 94.3 /100 | #118 | Exceptional 5.8% |
| South Africans | 94.1 /100 | #119 | Exceptional 5.8% |