Polish vs Immigrants from Liberia Single Mother Households
COMPARE
Polish
Immigrants from Liberia
Single Mother Households
Single Mother Households Comparison
Poles
Immigrants from Liberia
5.6%
SINGLE MOTHER HOUSEHOLDS
98.6/ 100
METRIC RATING
62nd/ 347
METRIC RANK
8.7%
SINGLE MOTHER HOUSEHOLDS
0.0/ 100
METRIC RATING
334th/ 347
METRIC RANK
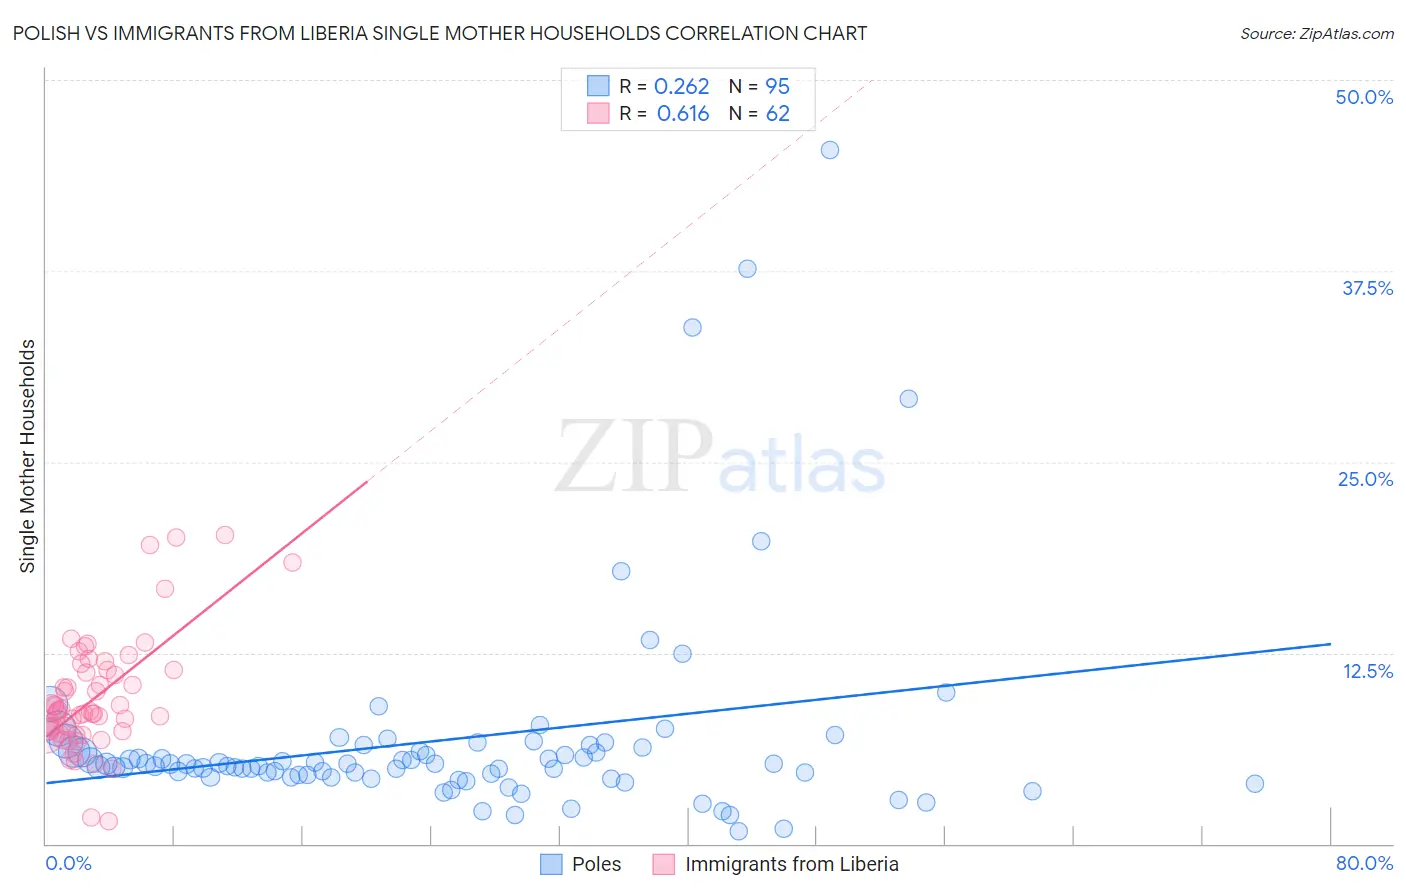
Polish vs Immigrants from Liberia Single Mother Households Correlation Chart
The statistical analysis conducted on geographies consisting of 555,545,245 people shows a weak positive correlation between the proportion of Poles and percentage of single mother households in the United States with a correlation coefficient (R) of 0.262 and weighted average of 5.6%. Similarly, the statistical analysis conducted on geographies consisting of 135,205,486 people shows a significant positive correlation between the proportion of Immigrants from Liberia and percentage of single mother households in the United States with a correlation coefficient (R) of 0.616 and weighted average of 8.7%, a difference of 56.3%.
Single Mother Households Correlation Summary
| Measurement | Polish | Immigrants from Liberia |
| Minimum | 0.85% | 1.4% |
| Maximum | 45.5% | 20.2% |
| Range | 44.6% | 18.8% |
| Mean | 6.8% | 9.6% |
| Median | 5.2% | 8.7% |
| Interquartile 25% (IQ1) | 4.4% | 7.4% |
| Interquartile 75% (IQ3) | 6.3% | 11.4% |
| Interquartile Range (IQR) | 1.9% | 4.0% |
| Standard Deviation (Sample) | 7.0% | 3.8% |
| Standard Deviation (Population) | 6.9% | 3.7% |
Similar Demographics by Single Mother Households
Demographics Similar to Poles by Single Mother Households
In terms of single mother households, the demographic groups most similar to Poles are Australian (5.6%, a difference of 0.010%), Immigrants from North Macedonia (5.6%, a difference of 0.070%), Immigrants from Norway (5.6%, a difference of 0.080%), Immigrants from France (5.6%, a difference of 0.10%), and Greek (5.6%, a difference of 0.15%).
| Demographics | Rating | Rank | Single Mother Households |
| Immigrants | Denmark | 99.1 /100 | #55 | Exceptional 5.5% |
| Immigrants | Romania | 99.0 /100 | #56 | Exceptional 5.5% |
| Immigrants | Europe | 99.0 /100 | #57 | Exceptional 5.5% |
| Danes | 98.9 /100 | #58 | Exceptional 5.5% |
| Luxembourgers | 98.7 /100 | #59 | Exceptional 5.6% |
| Immigrants | Norway | 98.7 /100 | #60 | Exceptional 5.6% |
| Australians | 98.7 /100 | #61 | Exceptional 5.6% |
| Poles | 98.6 /100 | #62 | Exceptional 5.6% |
| Immigrants | North Macedonia | 98.6 /100 | #63 | Exceptional 5.6% |
| Immigrants | France | 98.6 /100 | #64 | Exceptional 5.6% |
| Greeks | 98.6 /100 | #65 | Exceptional 5.6% |
| Immigrants | Canada | 98.5 /100 | #66 | Exceptional 5.6% |
| Italians | 98.5 /100 | #67 | Exceptional 5.6% |
| Immigrants | Bulgaria | 98.5 /100 | #68 | Exceptional 5.6% |
| Asians | 98.5 /100 | #69 | Exceptional 5.6% |
Demographics Similar to Immigrants from Liberia by Single Mother Households
In terms of single mother households, the demographic groups most similar to Immigrants from Liberia are Immigrants from Dominica (8.7%, a difference of 0.29%), Puerto Rican (8.7%, a difference of 0.33%), Liberian (8.6%, a difference of 0.80%), U.S. Virgin Islander (8.6%, a difference of 1.1%), and Navajo (8.8%, a difference of 1.5%).
| Demographics | Rating | Rank | Single Mother Households |
| Immigrants | Haiti | 0.0 /100 | #327 | Tragic 8.4% |
| Yakama | 0.0 /100 | #328 | Tragic 8.4% |
| Hopi | 0.0 /100 | #329 | Tragic 8.5% |
| Inupiat | 0.0 /100 | #330 | Tragic 8.5% |
| Sioux | 0.0 /100 | #331 | Tragic 8.5% |
| U.S. Virgin Islanders | 0.0 /100 | #332 | Tragic 8.6% |
| Liberians | 0.0 /100 | #333 | Tragic 8.6% |
| Immigrants | Liberia | 0.0 /100 | #334 | Tragic 8.7% |
| Immigrants | Dominica | 0.0 /100 | #335 | Tragic 8.7% |
| Puerto Ricans | 0.0 /100 | #336 | Tragic 8.7% |
| Navajo | 0.0 /100 | #337 | Tragic 8.8% |
| Cape Verdeans | 0.0 /100 | #338 | Tragic 8.9% |
| Blacks/African Americans | 0.0 /100 | #339 | Tragic 9.0% |
| Lumbee | 0.0 /100 | #340 | Tragic 9.1% |
| Tohono O'odham | 0.0 /100 | #341 | Tragic 9.1% |