Immigrants from St. Vincent and the Grenadines vs Immigrants from Poland Single Mother Households
COMPARE
Immigrants from St. Vincent and the Grenadines
Immigrants from Poland
Single Mother Households
Single Mother Households Comparison
Immigrants from St. Vincent and the Grenadines
Immigrants from Poland
8.0%
SINGLE MOTHER HOUSEHOLDS
0.0/ 100
METRIC RATING
307th/ 347
METRIC RANK
5.8%
SINGLE MOTHER HOUSEHOLDS
96.3/ 100
METRIC RATING
99th/ 347
METRIC RANK
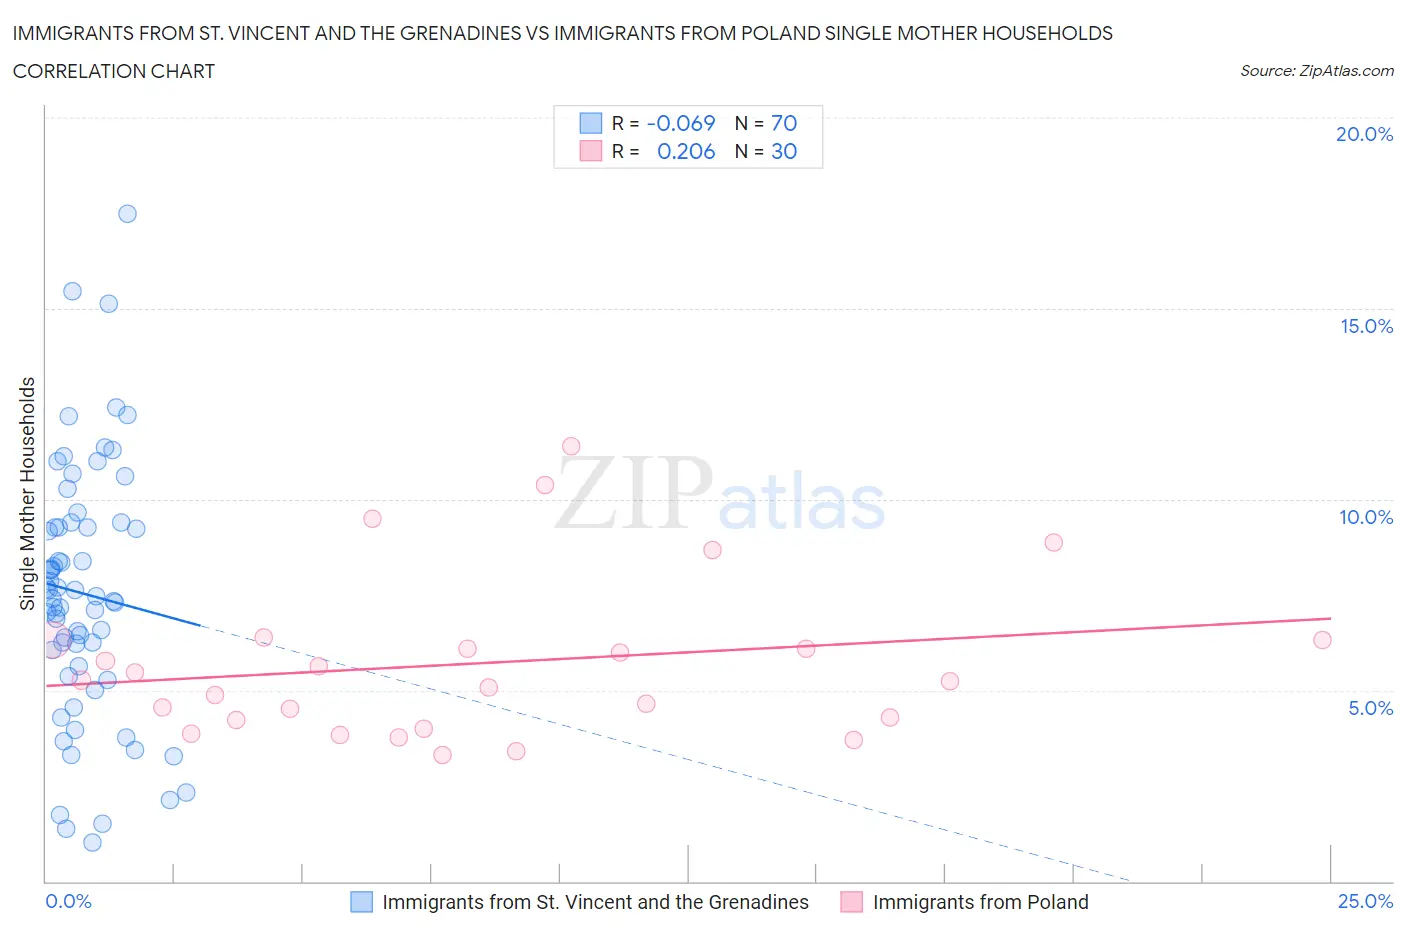
Immigrants from St. Vincent and the Grenadines vs Immigrants from Poland Single Mother Households Correlation Chart
The statistical analysis conducted on geographies consisting of 56,167,632 people shows a slight negative correlation between the proportion of Immigrants from St. Vincent and the Grenadines and percentage of single mother households in the United States with a correlation coefficient (R) of -0.069 and weighted average of 8.0%. Similarly, the statistical analysis conducted on geographies consisting of 304,111,620 people shows a weak positive correlation between the proportion of Immigrants from Poland and percentage of single mother households in the United States with a correlation coefficient (R) of 0.206 and weighted average of 5.8%, a difference of 40.0%.
Single Mother Households Correlation Summary
| Measurement | Immigrants from St. Vincent and the Grenadines | Immigrants from Poland |
| Minimum | 1.0% | 3.3% |
| Maximum | 17.5% | 11.4% |
| Range | 16.5% | 8.1% |
| Mean | 7.5% | 5.7% |
| Median | 7.4% | 5.3% |
| Interquartile 25% (IQ1) | 5.6% | 4.2% |
| Interquartile 75% (IQ3) | 9.3% | 6.3% |
| Interquartile Range (IQR) | 3.6% | 2.1% |
| Standard Deviation (Sample) | 3.3% | 2.1% |
| Standard Deviation (Population) | 3.3% | 2.1% |
Similar Demographics by Single Mother Households
Demographics Similar to Immigrants from St. Vincent and the Grenadines by Single Mother Households
In terms of single mother households, the demographic groups most similar to Immigrants from St. Vincent and the Grenadines are Immigrants from Central America (8.1%, a difference of 0.020%), Immigrants from Barbados (8.0%, a difference of 0.24%), Colville (8.0%, a difference of 0.32%), Native/Alaskan (8.0%, a difference of 0.36%), and Cheyenne (8.1%, a difference of 0.46%).
| Demographics | Rating | Rank | Single Mother Households |
| Mexicans | 0.0 /100 | #300 | Tragic 8.0% |
| Chippewa | 0.0 /100 | #301 | Tragic 8.0% |
| Immigrants | Ghana | 0.0 /100 | #302 | Tragic 8.0% |
| Immigrants | Bahamas | 0.0 /100 | #303 | Tragic 8.0% |
| Natives/Alaskans | 0.0 /100 | #304 | Tragic 8.0% |
| Colville | 0.0 /100 | #305 | Tragic 8.0% |
| Immigrants | Barbados | 0.0 /100 | #306 | Tragic 8.0% |
| Immigrants | St. Vincent and the Grenadines | 0.0 /100 | #307 | Tragic 8.0% |
| Immigrants | Central America | 0.0 /100 | #308 | Tragic 8.1% |
| Cheyenne | 0.0 /100 | #309 | Tragic 8.1% |
| Hondurans | 0.0 /100 | #310 | Tragic 8.1% |
| Immigrants | Congo | 0.0 /100 | #311 | Tragic 8.1% |
| Bangladeshis | 0.0 /100 | #312 | Tragic 8.1% |
| Immigrants | Grenada | 0.0 /100 | #313 | Tragic 8.2% |
| Immigrants | Mexico | 0.0 /100 | #314 | Tragic 8.2% |
Demographics Similar to Immigrants from Poland by Single Mother Households
In terms of single mother households, the demographic groups most similar to Immigrants from Poland are Scandinavian (5.8%, a difference of 0.010%), German (5.8%, a difference of 0.040%), Immigrants from South Africa (5.7%, a difference of 0.050%), English (5.8%, a difference of 0.050%), and Scottish (5.8%, a difference of 0.070%).
| Demographics | Rating | Rank | Single Mother Households |
| Immigrants | Western Asia | 96.7 /100 | #92 | Exceptional 5.7% |
| Serbians | 96.7 /100 | #93 | Exceptional 5.7% |
| Basques | 96.7 /100 | #94 | Exceptional 5.7% |
| Slovaks | 96.6 /100 | #95 | Exceptional 5.7% |
| Austrians | 96.4 /100 | #96 | Exceptional 5.7% |
| Tlingit-Haida | 96.4 /100 | #97 | Exceptional 5.7% |
| Immigrants | South Africa | 96.3 /100 | #98 | Exceptional 5.7% |
| Immigrants | Poland | 96.3 /100 | #99 | Exceptional 5.8% |
| Scandinavians | 96.2 /100 | #100 | Exceptional 5.8% |
| Germans | 96.2 /100 | #101 | Exceptional 5.8% |
| English | 96.2 /100 | #102 | Exceptional 5.8% |
| Scottish | 96.2 /100 | #103 | Exceptional 5.8% |
| Northern Europeans | 96.2 /100 | #104 | Exceptional 5.8% |
| Taiwanese | 96.1 /100 | #105 | Exceptional 5.8% |
| Immigrants | Ukraine | 95.9 /100 | #106 | Exceptional 5.8% |