Mexican American Indian vs Immigrants from Poland Single Mother Households
COMPARE
Mexican American Indian
Immigrants from Poland
Single Mother Households
Single Mother Households Comparison
Mexican American Indians
Immigrants from Poland
7.4%
SINGLE MOTHER HOUSEHOLDS
0.2/ 100
METRIC RATING
255th/ 347
METRIC RANK
5.8%
SINGLE MOTHER HOUSEHOLDS
96.3/ 100
METRIC RATING
99th/ 347
METRIC RANK
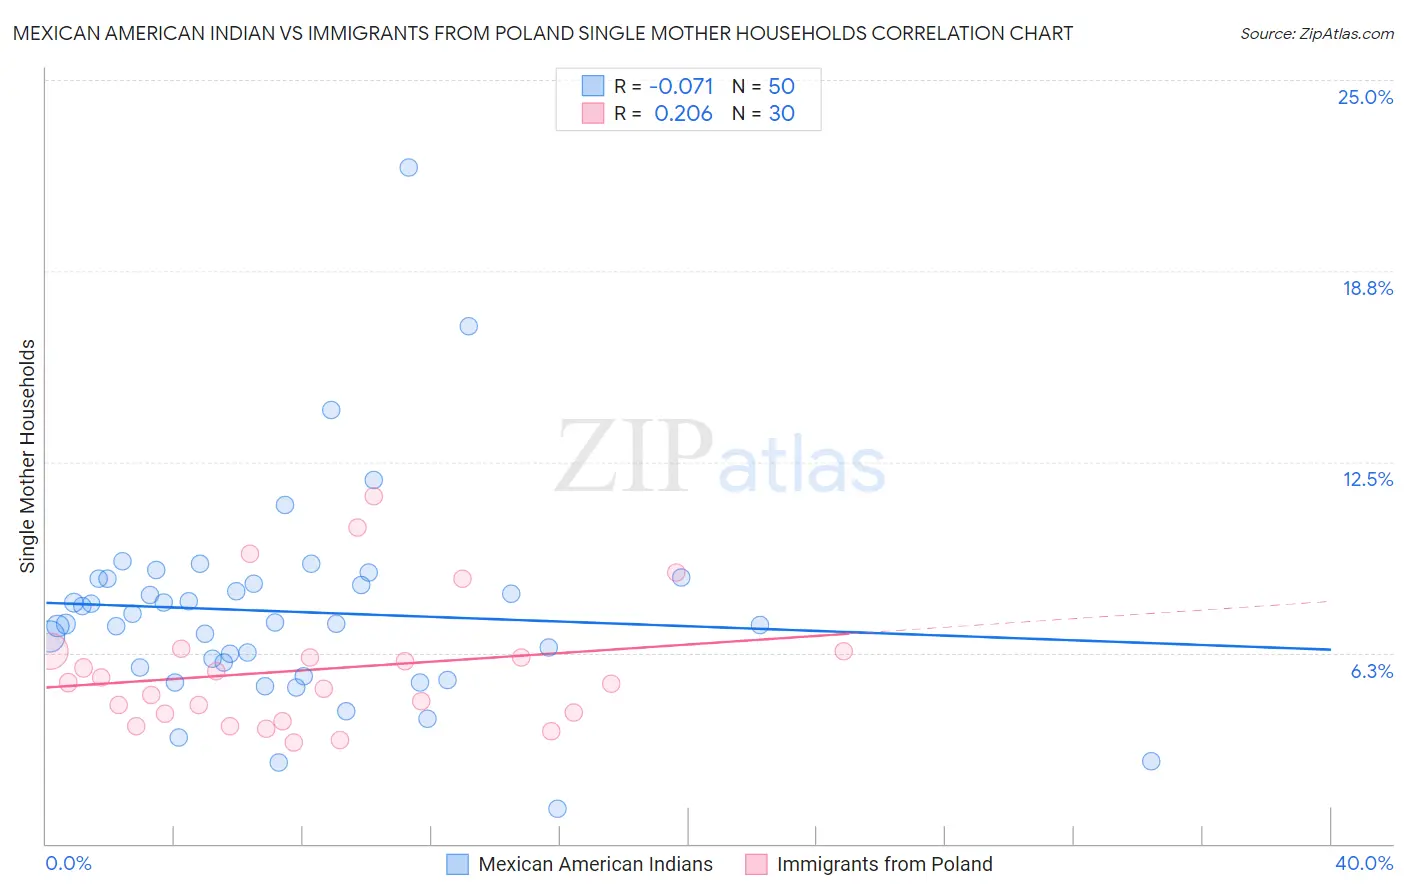
Mexican American Indian vs Immigrants from Poland Single Mother Households Correlation Chart
The statistical analysis conducted on geographies consisting of 317,232,303 people shows a slight negative correlation between the proportion of Mexican American Indians and percentage of single mother households in the United States with a correlation coefficient (R) of -0.071 and weighted average of 7.4%. Similarly, the statistical analysis conducted on geographies consisting of 304,111,620 people shows a weak positive correlation between the proportion of Immigrants from Poland and percentage of single mother households in the United States with a correlation coefficient (R) of 0.206 and weighted average of 5.8%, a difference of 28.1%.
Single Mother Households Correlation Summary
| Measurement | Mexican American Indian | Immigrants from Poland |
| Minimum | 1.1% | 3.3% |
| Maximum | 22.1% | 11.4% |
| Range | 21.0% | 8.1% |
| Mean | 7.6% | 5.7% |
| Median | 7.2% | 5.3% |
| Interquartile 25% (IQ1) | 5.8% | 4.2% |
| Interquartile 75% (IQ3) | 8.7% | 6.3% |
| Interquartile Range (IQR) | 2.9% | 2.1% |
| Standard Deviation (Sample) | 3.4% | 2.1% |
| Standard Deviation (Population) | 3.4% | 2.1% |
Similar Demographics by Single Mother Households
Demographics Similar to Mexican American Indians by Single Mother Households
In terms of single mother households, the demographic groups most similar to Mexican American Indians are Seminole (7.4%, a difference of 0.36%), Immigrants from Ecuador (7.3%, a difference of 0.37%), Alaska Native (7.4%, a difference of 0.40%), Cajun (7.3%, a difference of 0.42%), and Pueblo (7.4%, a difference of 0.42%).
| Demographics | Rating | Rank | Single Mother Households |
| Spanish American Indians | 0.4 /100 | #248 | Tragic 7.3% |
| Bermudans | 0.4 /100 | #249 | Tragic 7.3% |
| Immigrants | Africa | 0.4 /100 | #250 | Tragic 7.3% |
| Malaysians | 0.3 /100 | #251 | Tragic 7.3% |
| Alaskan Athabascans | 0.3 /100 | #252 | Tragic 7.3% |
| Cajuns | 0.3 /100 | #253 | Tragic 7.3% |
| Immigrants | Ecuador | 0.3 /100 | #254 | Tragic 7.3% |
| Mexican American Indians | 0.2 /100 | #255 | Tragic 7.4% |
| Seminole | 0.2 /100 | #256 | Tragic 7.4% |
| Alaska Natives | 0.2 /100 | #257 | Tragic 7.4% |
| Pueblo | 0.2 /100 | #258 | Tragic 7.4% |
| Immigrants | Yemen | 0.2 /100 | #259 | Tragic 7.4% |
| Immigrants | Zaire | 0.2 /100 | #260 | Tragic 7.4% |
| Japanese | 0.2 /100 | #261 | Tragic 7.4% |
| Immigrants | Somalia | 0.2 /100 | #262 | Tragic 7.4% |
Demographics Similar to Immigrants from Poland by Single Mother Households
In terms of single mother households, the demographic groups most similar to Immigrants from Poland are Scandinavian (5.8%, a difference of 0.010%), German (5.8%, a difference of 0.040%), Immigrants from South Africa (5.7%, a difference of 0.050%), English (5.8%, a difference of 0.050%), and Scottish (5.8%, a difference of 0.070%).
| Demographics | Rating | Rank | Single Mother Households |
| Immigrants | Western Asia | 96.7 /100 | #92 | Exceptional 5.7% |
| Serbians | 96.7 /100 | #93 | Exceptional 5.7% |
| Basques | 96.7 /100 | #94 | Exceptional 5.7% |
| Slovaks | 96.6 /100 | #95 | Exceptional 5.7% |
| Austrians | 96.4 /100 | #96 | Exceptional 5.7% |
| Tlingit-Haida | 96.4 /100 | #97 | Exceptional 5.7% |
| Immigrants | South Africa | 96.3 /100 | #98 | Exceptional 5.7% |
| Immigrants | Poland | 96.3 /100 | #99 | Exceptional 5.8% |
| Scandinavians | 96.2 /100 | #100 | Exceptional 5.8% |
| Germans | 96.2 /100 | #101 | Exceptional 5.8% |
| English | 96.2 /100 | #102 | Exceptional 5.8% |
| Scottish | 96.2 /100 | #103 | Exceptional 5.8% |
| Northern Europeans | 96.2 /100 | #104 | Exceptional 5.8% |
| Taiwanese | 96.1 /100 | #105 | Exceptional 5.8% |
| Immigrants | Ukraine | 95.9 /100 | #106 | Exceptional 5.8% |