Polish vs Native/Alaskan Single Mother Households
COMPARE
Polish
Native/Alaskan
Single Mother Households
Single Mother Households Comparison
Poles
Natives/Alaskans
5.6%
SINGLE MOTHER HOUSEHOLDS
98.6/ 100
METRIC RATING
62nd/ 347
METRIC RANK
8.0%
SINGLE MOTHER HOUSEHOLDS
0.0/ 100
METRIC RATING
304th/ 347
METRIC RANK
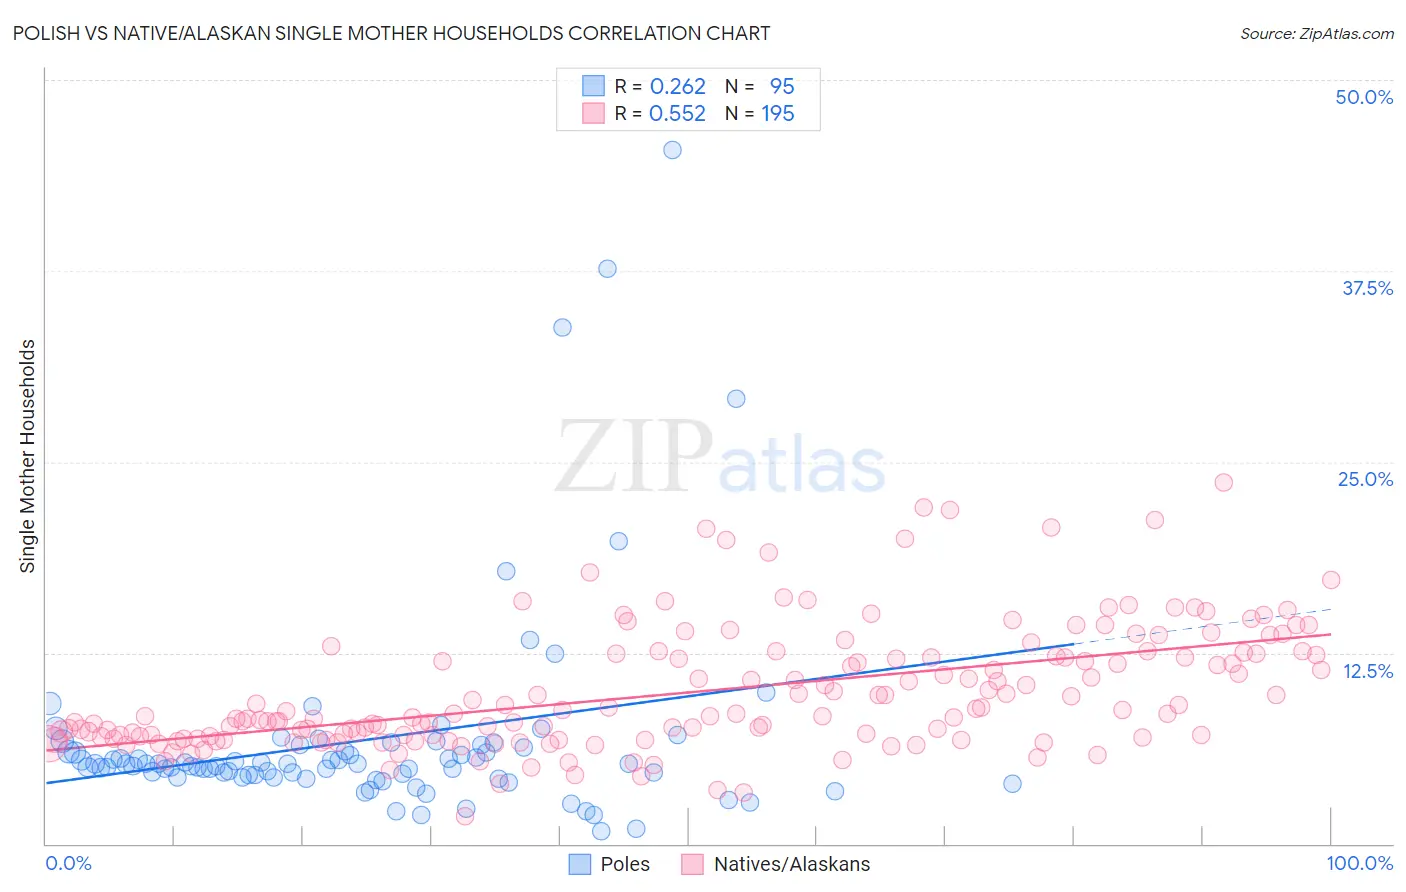
Polish vs Native/Alaskan Single Mother Households Correlation Chart
The statistical analysis conducted on geographies consisting of 555,545,245 people shows a weak positive correlation between the proportion of Poles and percentage of single mother households in the United States with a correlation coefficient (R) of 0.262 and weighted average of 5.6%. Similarly, the statistical analysis conducted on geographies consisting of 510,596,383 people shows a substantial positive correlation between the proportion of Natives/Alaskans and percentage of single mother households in the United States with a correlation coefficient (R) of 0.552 and weighted average of 8.0%, a difference of 44.0%.
Single Mother Households Correlation Summary
| Measurement | Polish | Native/Alaskan |
| Minimum | 0.85% | 1.8% |
| Maximum | 45.5% | 23.6% |
| Range | 44.6% | 21.8% |
| Mean | 6.8% | 9.9% |
| Median | 5.2% | 8.4% |
| Interquartile 25% (IQ1) | 4.4% | 7.0% |
| Interquartile 75% (IQ3) | 6.3% | 12.4% |
| Interquartile Range (IQR) | 1.9% | 5.4% |
| Standard Deviation (Sample) | 7.0% | 4.0% |
| Standard Deviation (Population) | 6.9% | 4.0% |
Similar Demographics by Single Mother Households
Demographics Similar to Poles by Single Mother Households
In terms of single mother households, the demographic groups most similar to Poles are Australian (5.6%, a difference of 0.010%), Immigrants from North Macedonia (5.6%, a difference of 0.070%), Immigrants from Norway (5.6%, a difference of 0.080%), Immigrants from France (5.6%, a difference of 0.10%), and Greek (5.6%, a difference of 0.15%).
| Demographics | Rating | Rank | Single Mother Households |
| Immigrants | Denmark | 99.1 /100 | #55 | Exceptional 5.5% |
| Immigrants | Romania | 99.0 /100 | #56 | Exceptional 5.5% |
| Immigrants | Europe | 99.0 /100 | #57 | Exceptional 5.5% |
| Danes | 98.9 /100 | #58 | Exceptional 5.5% |
| Luxembourgers | 98.7 /100 | #59 | Exceptional 5.6% |
| Immigrants | Norway | 98.7 /100 | #60 | Exceptional 5.6% |
| Australians | 98.7 /100 | #61 | Exceptional 5.6% |
| Poles | 98.6 /100 | #62 | Exceptional 5.6% |
| Immigrants | North Macedonia | 98.6 /100 | #63 | Exceptional 5.6% |
| Immigrants | France | 98.6 /100 | #64 | Exceptional 5.6% |
| Greeks | 98.6 /100 | #65 | Exceptional 5.6% |
| Immigrants | Canada | 98.5 /100 | #66 | Exceptional 5.6% |
| Italians | 98.5 /100 | #67 | Exceptional 5.6% |
| Immigrants | Bulgaria | 98.5 /100 | #68 | Exceptional 5.6% |
| Asians | 98.5 /100 | #69 | Exceptional 5.6% |
Demographics Similar to Natives/Alaskans by Single Mother Households
In terms of single mother households, the demographic groups most similar to Natives/Alaskans are Colville (8.0%, a difference of 0.050%), Immigrants from Barbados (8.0%, a difference of 0.12%), Immigrants from St. Vincent and the Grenadines (8.0%, a difference of 0.36%), Immigrants from Central America (8.1%, a difference of 0.38%), and Immigrants from Bahamas (8.0%, a difference of 0.44%).
| Demographics | Rating | Rank | Single Mother Households |
| Hispanics or Latinos | 0.0 /100 | #297 | Tragic 7.9% |
| Immigrants | West Indies | 0.0 /100 | #298 | Tragic 7.9% |
| Houma | 0.0 /100 | #299 | Tragic 7.9% |
| Mexicans | 0.0 /100 | #300 | Tragic 8.0% |
| Chippewa | 0.0 /100 | #301 | Tragic 8.0% |
| Immigrants | Ghana | 0.0 /100 | #302 | Tragic 8.0% |
| Immigrants | Bahamas | 0.0 /100 | #303 | Tragic 8.0% |
| Natives/Alaskans | 0.0 /100 | #304 | Tragic 8.0% |
| Colville | 0.0 /100 | #305 | Tragic 8.0% |
| Immigrants | Barbados | 0.0 /100 | #306 | Tragic 8.0% |
| Immigrants | St. Vincent and the Grenadines | 0.0 /100 | #307 | Tragic 8.0% |
| Immigrants | Central America | 0.0 /100 | #308 | Tragic 8.1% |
| Cheyenne | 0.0 /100 | #309 | Tragic 8.1% |
| Hondurans | 0.0 /100 | #310 | Tragic 8.1% |
| Immigrants | Congo | 0.0 /100 | #311 | Tragic 8.1% |