Sioux vs Immigrants from Poland Single Mother Households
COMPARE
Sioux
Immigrants from Poland
Single Mother Households
Single Mother Households Comparison
Sioux
Immigrants from Poland
8.5%
SINGLE MOTHER HOUSEHOLDS
0.0/ 100
METRIC RATING
331st/ 347
METRIC RANK
5.8%
SINGLE MOTHER HOUSEHOLDS
96.3/ 100
METRIC RATING
99th/ 347
METRIC RANK
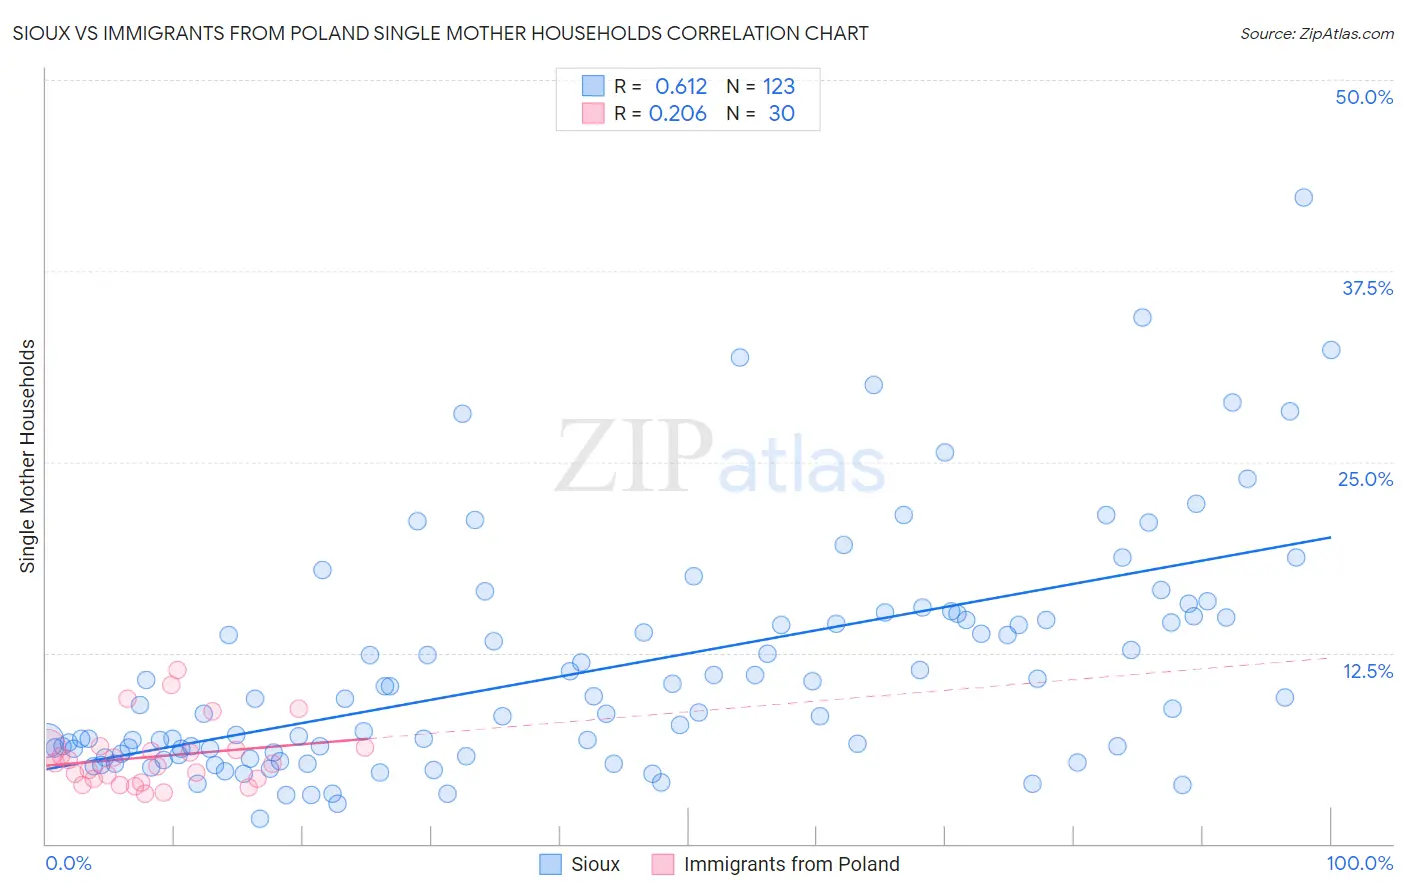
Sioux vs Immigrants from Poland Single Mother Households Correlation Chart
The statistical analysis conducted on geographies consisting of 233,811,007 people shows a significant positive correlation between the proportion of Sioux and percentage of single mother households in the United States with a correlation coefficient (R) of 0.612 and weighted average of 8.5%. Similarly, the statistical analysis conducted on geographies consisting of 304,111,620 people shows a weak positive correlation between the proportion of Immigrants from Poland and percentage of single mother households in the United States with a correlation coefficient (R) of 0.206 and weighted average of 5.8%, a difference of 47.5%.
Single Mother Households Correlation Summary
| Measurement | Sioux | Immigrants from Poland |
| Minimum | 1.6% | 3.3% |
| Maximum | 42.3% | 11.4% |
| Range | 40.7% | 8.1% |
| Mean | 11.4% | 5.7% |
| Median | 9.1% | 5.3% |
| Interquartile 25% (IQ1) | 5.9% | 4.2% |
| Interquartile 75% (IQ3) | 14.8% | 6.3% |
| Interquartile Range (IQR) | 8.9% | 2.1% |
| Standard Deviation (Sample) | 7.6% | 2.1% |
| Standard Deviation (Population) | 7.6% | 2.1% |
Similar Demographics by Single Mother Households
Demographics Similar to Sioux by Single Mother Households
In terms of single mother households, the demographic groups most similar to Sioux are Inupiat (8.5%, a difference of 0.0%), Hopi (8.5%, a difference of 0.11%), Yakama (8.4%, a difference of 0.86%), Immigrants from Haiti (8.4%, a difference of 1.0%), and British West Indian (8.4%, a difference of 1.2%).
| Demographics | Rating | Rank | Single Mother Households |
| Immigrants | Jamaica | 0.0 /100 | #324 | Tragic 8.4% |
| Immigrants | Caribbean | 0.0 /100 | #325 | Tragic 8.4% |
| British West Indians | 0.0 /100 | #326 | Tragic 8.4% |
| Immigrants | Haiti | 0.0 /100 | #327 | Tragic 8.4% |
| Yakama | 0.0 /100 | #328 | Tragic 8.4% |
| Hopi | 0.0 /100 | #329 | Tragic 8.5% |
| Inupiat | 0.0 /100 | #330 | Tragic 8.5% |
| Sioux | 0.0 /100 | #331 | Tragic 8.5% |
| U.S. Virgin Islanders | 0.0 /100 | #332 | Tragic 8.6% |
| Liberians | 0.0 /100 | #333 | Tragic 8.6% |
| Immigrants | Liberia | 0.0 /100 | #334 | Tragic 8.7% |
| Immigrants | Dominica | 0.0 /100 | #335 | Tragic 8.7% |
| Puerto Ricans | 0.0 /100 | #336 | Tragic 8.7% |
| Navajo | 0.0 /100 | #337 | Tragic 8.8% |
| Cape Verdeans | 0.0 /100 | #338 | Tragic 8.9% |
Demographics Similar to Immigrants from Poland by Single Mother Households
In terms of single mother households, the demographic groups most similar to Immigrants from Poland are Scandinavian (5.8%, a difference of 0.010%), German (5.8%, a difference of 0.040%), Immigrants from South Africa (5.7%, a difference of 0.050%), English (5.8%, a difference of 0.050%), and Scottish (5.8%, a difference of 0.070%).
| Demographics | Rating | Rank | Single Mother Households |
| Immigrants | Western Asia | 96.7 /100 | #92 | Exceptional 5.7% |
| Serbians | 96.7 /100 | #93 | Exceptional 5.7% |
| Basques | 96.7 /100 | #94 | Exceptional 5.7% |
| Slovaks | 96.6 /100 | #95 | Exceptional 5.7% |
| Austrians | 96.4 /100 | #96 | Exceptional 5.7% |
| Tlingit-Haida | 96.4 /100 | #97 | Exceptional 5.7% |
| Immigrants | South Africa | 96.3 /100 | #98 | Exceptional 5.7% |
| Immigrants | Poland | 96.3 /100 | #99 | Exceptional 5.8% |
| Scandinavians | 96.2 /100 | #100 | Exceptional 5.8% |
| Germans | 96.2 /100 | #101 | Exceptional 5.8% |
| English | 96.2 /100 | #102 | Exceptional 5.8% |
| Scottish | 96.2 /100 | #103 | Exceptional 5.8% |
| Northern Europeans | 96.2 /100 | #104 | Exceptional 5.8% |
| Taiwanese | 96.1 /100 | #105 | Exceptional 5.8% |
| Immigrants | Ukraine | 95.9 /100 | #106 | Exceptional 5.8% |