Inupiat vs Immigrants from Kuwait Single Mother Households
COMPARE
Inupiat
Immigrants from Kuwait
Single Mother Households
Single Mother Households Comparison
Inupiat
Immigrants from Kuwait
8.5%
SINGLE MOTHER HOUSEHOLDS
0.0/ 100
METRIC RATING
330th/ 347
METRIC RANK
5.8%
SINGLE MOTHER HOUSEHOLDS
95.4/ 100
METRIC RATING
112th/ 347
METRIC RANK
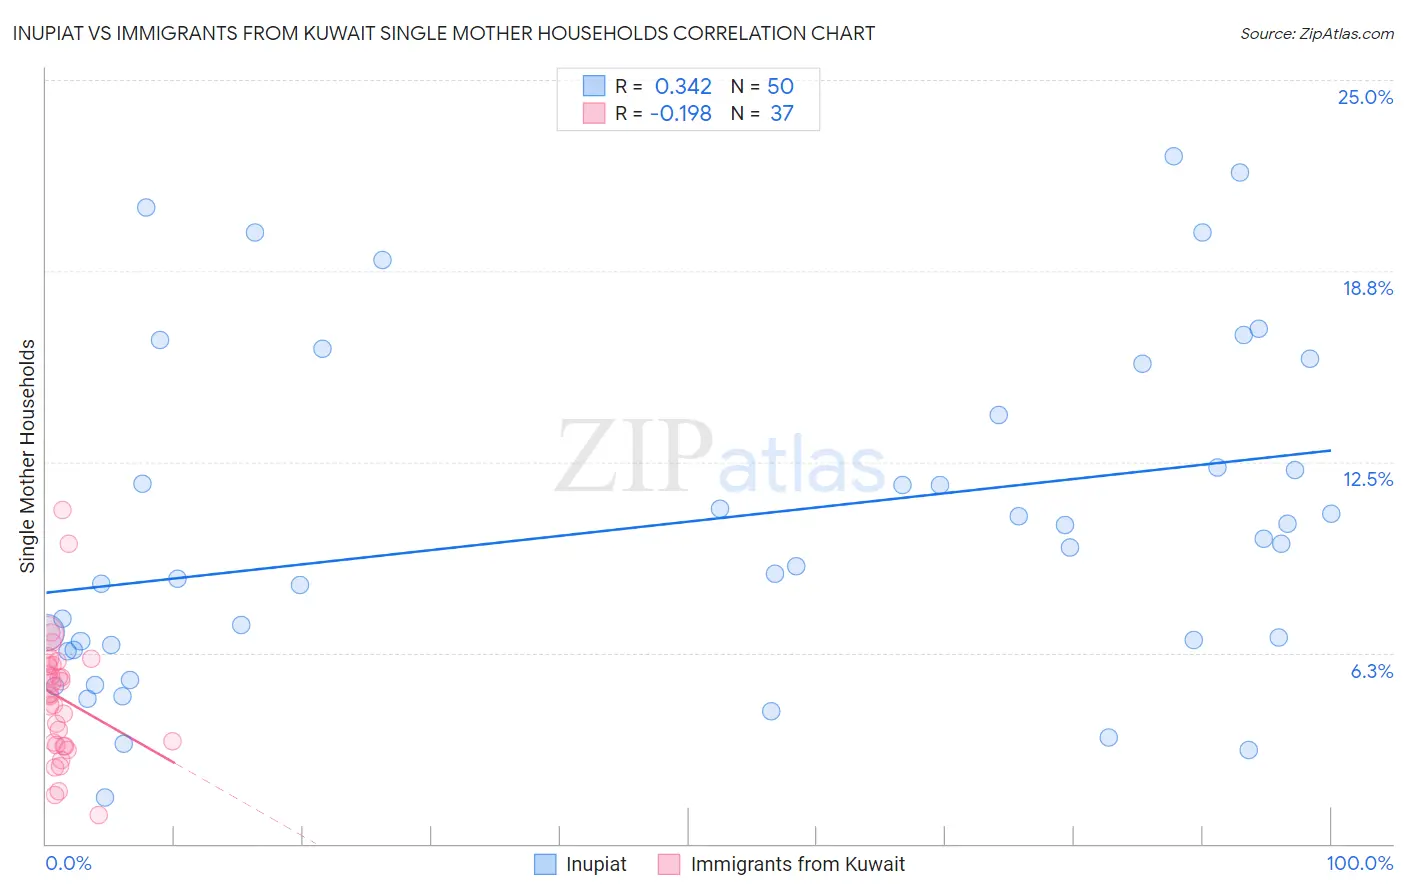
Inupiat vs Immigrants from Kuwait Single Mother Households Correlation Chart
The statistical analysis conducted on geographies consisting of 96,271,599 people shows a mild positive correlation between the proportion of Inupiat and percentage of single mother households in the United States with a correlation coefficient (R) of 0.342 and weighted average of 8.5%. Similarly, the statistical analysis conducted on geographies consisting of 136,852,016 people shows a poor negative correlation between the proportion of Immigrants from Kuwait and percentage of single mother households in the United States with a correlation coefficient (R) of -0.198 and weighted average of 5.8%, a difference of 46.6%.
Single Mother Households Correlation Summary
| Measurement | Inupiat | Immigrants from Kuwait |
| Minimum | 1.5% | 0.94% |
| Maximum | 22.5% | 10.9% |
| Range | 21.0% | 10.0% |
| Mean | 10.5% | 4.8% |
| Median | 9.7% | 4.9% |
| Interquartile 25% (IQ1) | 6.5% | 3.2% |
| Interquartile 75% (IQ3) | 14.0% | 5.9% |
| Interquartile Range (IQR) | 7.5% | 2.6% |
| Standard Deviation (Sample) | 5.4% | 2.1% |
| Standard Deviation (Population) | 5.4% | 2.0% |
Similar Demographics by Single Mother Households
Demographics Similar to Inupiat by Single Mother Households
In terms of single mother households, the demographic groups most similar to Inupiat are Sioux (8.5%, a difference of 0.0%), Hopi (8.5%, a difference of 0.11%), Yakama (8.4%, a difference of 0.85%), Immigrants from Haiti (8.4%, a difference of 1.0%), and British West Indian (8.4%, a difference of 1.2%).
| Demographics | Rating | Rank | Single Mother Households |
| Haitians | 0.0 /100 | #323 | Tragic 8.3% |
| Immigrants | Jamaica | 0.0 /100 | #324 | Tragic 8.4% |
| Immigrants | Caribbean | 0.0 /100 | #325 | Tragic 8.4% |
| British West Indians | 0.0 /100 | #326 | Tragic 8.4% |
| Immigrants | Haiti | 0.0 /100 | #327 | Tragic 8.4% |
| Yakama | 0.0 /100 | #328 | Tragic 8.4% |
| Hopi | 0.0 /100 | #329 | Tragic 8.5% |
| Inupiat | 0.0 /100 | #330 | Tragic 8.5% |
| Sioux | 0.0 /100 | #331 | Tragic 8.5% |
| U.S. Virgin Islanders | 0.0 /100 | #332 | Tragic 8.6% |
| Liberians | 0.0 /100 | #333 | Tragic 8.6% |
| Immigrants | Liberia | 0.0 /100 | #334 | Tragic 8.7% |
| Immigrants | Dominica | 0.0 /100 | #335 | Tragic 8.7% |
| Puerto Ricans | 0.0 /100 | #336 | Tragic 8.7% |
| Navajo | 0.0 /100 | #337 | Tragic 8.8% |
Demographics Similar to Immigrants from Kuwait by Single Mother Households
In terms of single mother households, the demographic groups most similar to Immigrants from Kuwait are Immigrants from England (5.8%, a difference of 0.040%), British (5.8%, a difference of 0.070%), Mongolian (5.8%, a difference of 0.070%), Immigrants from Western Europe (5.8%, a difference of 0.16%), and Dutch (5.8%, a difference of 0.20%).
| Demographics | Rating | Rank | Single Mother Households |
| Taiwanese | 96.1 /100 | #105 | Exceptional 5.8% |
| Immigrants | Ukraine | 95.9 /100 | #106 | Exceptional 5.8% |
| Paraguayans | 95.8 /100 | #107 | Exceptional 5.8% |
| Immigrants | Italy | 95.8 /100 | #108 | Exceptional 5.8% |
| Immigrants | Western Europe | 95.7 /100 | #109 | Exceptional 5.8% |
| British | 95.5 /100 | #110 | Exceptional 5.8% |
| Immigrants | England | 95.5 /100 | #111 | Exceptional 5.8% |
| Immigrants | Kuwait | 95.4 /100 | #112 | Exceptional 5.8% |
| Mongolians | 95.3 /100 | #113 | Exceptional 5.8% |
| Dutch | 95.1 /100 | #114 | Exceptional 5.8% |
| Irish | 94.8 /100 | #115 | Exceptional 5.8% |
| Pennsylvania Germans | 94.7 /100 | #116 | Exceptional 5.8% |
| Bolivians | 94.6 /100 | #117 | Exceptional 5.8% |
| Laotians | 94.3 /100 | #118 | Exceptional 5.8% |
| South Africans | 94.1 /100 | #119 | Exceptional 5.8% |