Polish vs Immigrants from Kuwait 7th Grade
COMPARE
Polish
Immigrants from Kuwait
7th Grade
7th Grade Comparison
Poles
Immigrants from Kuwait
97.6%
7TH GRADE
100.0/ 100
METRIC RATING
12th/ 347
METRIC RANK
96.4%
7TH GRADE
91.1/ 100
METRIC RATING
135th/ 347
METRIC RANK
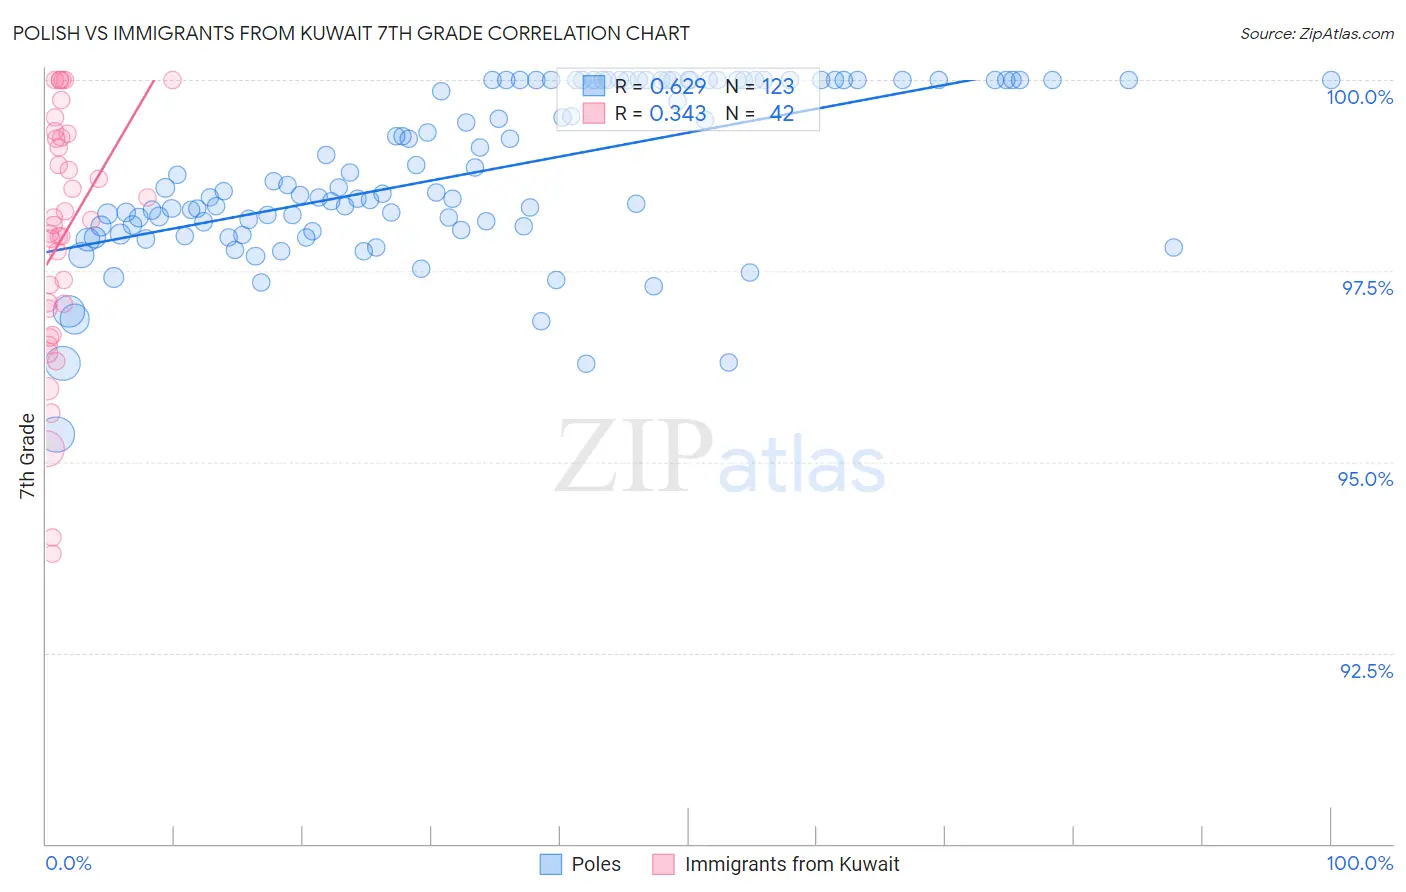
Polish vs Immigrants from Kuwait 7th Grade Correlation Chart
The statistical analysis conducted on geographies consisting of 475,812,379 people shows a significant positive correlation between the proportion of Poles and percentage of population with at least 7th grade education in the United States with a correlation coefficient (R) of 0.629 and weighted average of 97.6%. Similarly, the statistical analysis conducted on geographies consisting of 136,913,666 people shows a mild positive correlation between the proportion of Immigrants from Kuwait and percentage of population with at least 7th grade education in the United States with a correlation coefficient (R) of 0.343 and weighted average of 96.4%, a difference of 1.3%.
7th Grade Correlation Summary
| Measurement | Polish | Immigrants from Kuwait |
| Minimum | 95.4% | 93.8% |
| Maximum | 100.0% | 100.0% |
| Range | 4.6% | 6.2% |
| Mean | 98.8% | 98.0% |
| Median | 98.5% | 98.1% |
| Interquartile 25% (IQ1) | 98.1% | 97.0% |
| Interquartile 75% (IQ3) | 100.0% | 99.2% |
| Interquartile Range (IQR) | 1.9% | 2.2% |
| Standard Deviation (Sample) | 1.1% | 1.6% |
| Standard Deviation (Population) | 1.1% | 1.6% |
Similar Demographics by 7th Grade
Demographics Similar to Poles by 7th Grade
In terms of 7th grade, the demographic groups most similar to Poles are Alaskan Athabascan (97.6%, a difference of 0.010%), Slovene (97.6%, a difference of 0.020%), Swedish (97.6%, a difference of 0.030%), Pennsylvania German (97.6%, a difference of 0.040%), and English (97.6%, a difference of 0.060%).
| Demographics | Rating | Rank | 7th Grade |
| Dutch | 100.0 /100 | #5 | Exceptional 97.9% |
| Tsimshian | 100.0 /100 | #6 | Exceptional 97.8% |
| Norwegians | 100.0 /100 | #7 | Exceptional 97.8% |
| Slovaks | 100.0 /100 | #8 | Exceptional 97.8% |
| Germans | 100.0 /100 | #9 | Exceptional 97.7% |
| Slovenes | 100.0 /100 | #10 | Exceptional 97.6% |
| Alaskan Athabascans | 100.0 /100 | #11 | Exceptional 97.6% |
| Poles | 100.0 /100 | #12 | Exceptional 97.6% |
| Swedes | 100.0 /100 | #13 | Exceptional 97.6% |
| Pennsylvania Germans | 100.0 /100 | #14 | Exceptional 97.6% |
| English | 100.0 /100 | #15 | Exceptional 97.6% |
| Irish | 100.0 /100 | #16 | Exceptional 97.5% |
| Scottish | 100.0 /100 | #17 | Exceptional 97.5% |
| Tlingit-Haida | 100.0 /100 | #18 | Exceptional 97.5% |
| Lithuanians | 100.0 /100 | #19 | Exceptional 97.5% |
Demographics Similar to Immigrants from Kuwait by 7th Grade
In terms of 7th grade, the demographic groups most similar to Immigrants from Kuwait are Soviet Union (96.4%, a difference of 0.0%), Colville (96.4%, a difference of 0.010%), Hmong (96.4%, a difference of 0.010%), Immigrants from Hungary (96.4%, a difference of 0.010%), and Filipino (96.4%, a difference of 0.020%).
| Demographics | Rating | Rank | 7th Grade |
| Immigrants | Romania | 93.2 /100 | #128 | Exceptional 96.4% |
| Immigrants | North Macedonia | 93.1 /100 | #129 | Exceptional 96.4% |
| Immigrants | Serbia | 92.8 /100 | #130 | Exceptional 96.4% |
| Filipinos | 92.1 /100 | #131 | Exceptional 96.4% |
| Colville | 91.7 /100 | #132 | Exceptional 96.4% |
| Hmong | 91.5 /100 | #133 | Exceptional 96.4% |
| Soviet Union | 91.2 /100 | #134 | Exceptional 96.4% |
| Immigrants | Kuwait | 91.1 /100 | #135 | Exceptional 96.4% |
| Immigrants | Hungary | 90.6 /100 | #136 | Exceptional 96.4% |
| Immigrants | Turkey | 90.2 /100 | #137 | Exceptional 96.4% |
| Jordanians | 90.0 /100 | #138 | Excellent 96.4% |
| Basques | 89.3 /100 | #139 | Excellent 96.4% |
| Cambodians | 88.3 /100 | #140 | Excellent 96.3% |
| Immigrants | South Central Asia | 87.1 /100 | #141 | Excellent 96.3% |
| Burmese | 87.1 /100 | #142 | Excellent 96.3% |